8-bit R2R DAC.
The following figure 1 shows the real implementation of 8-bit R2R DAC on a breadboard.Here we have the resistance of R and 2R. Input of DAC connected to digital pins, output connected to the digital oscilloscope.
Figure 2 shows LTSPICE schematic of R2R DAC with measured resistance values.
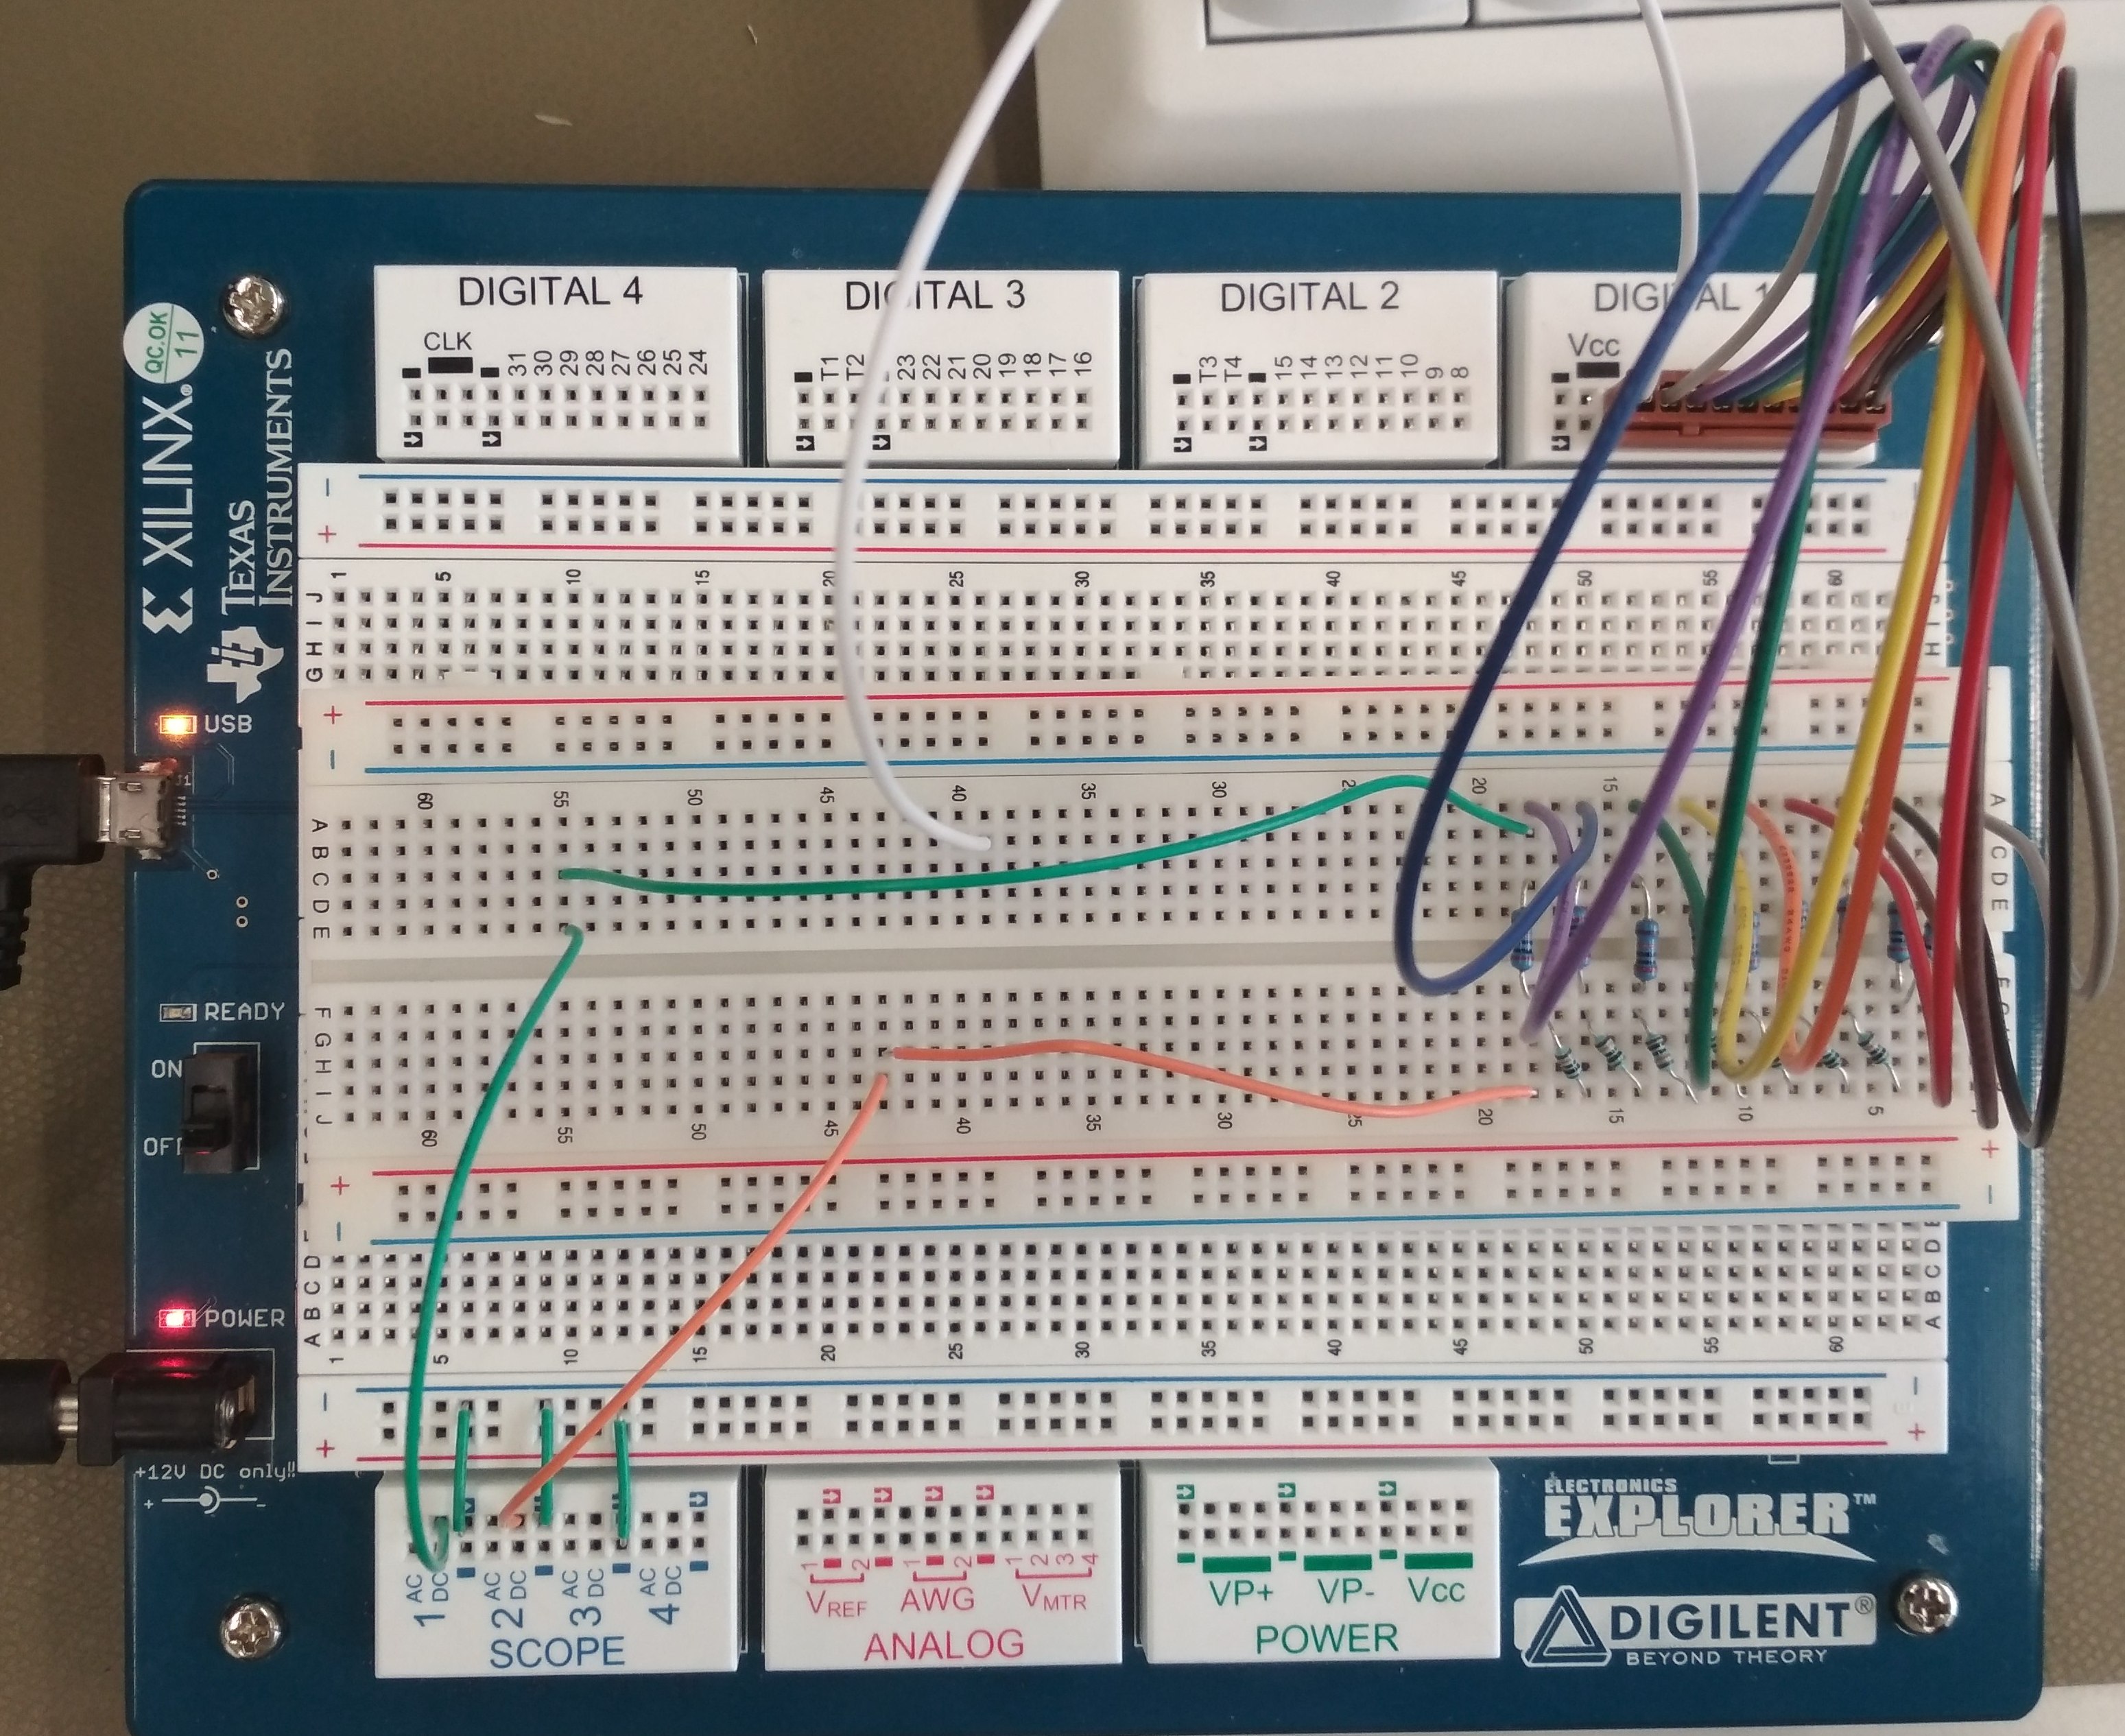
figure 1 |
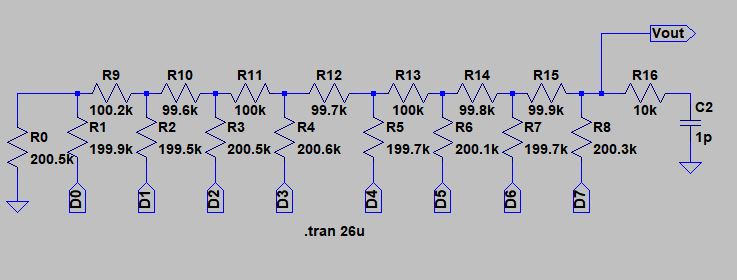
figure 2 |
Simulation of Ramp test
|
The simulation of Ramp test for different frequencies are shown in the figure. The frequencies are varied from 10 Khz to 10 Mhz. |
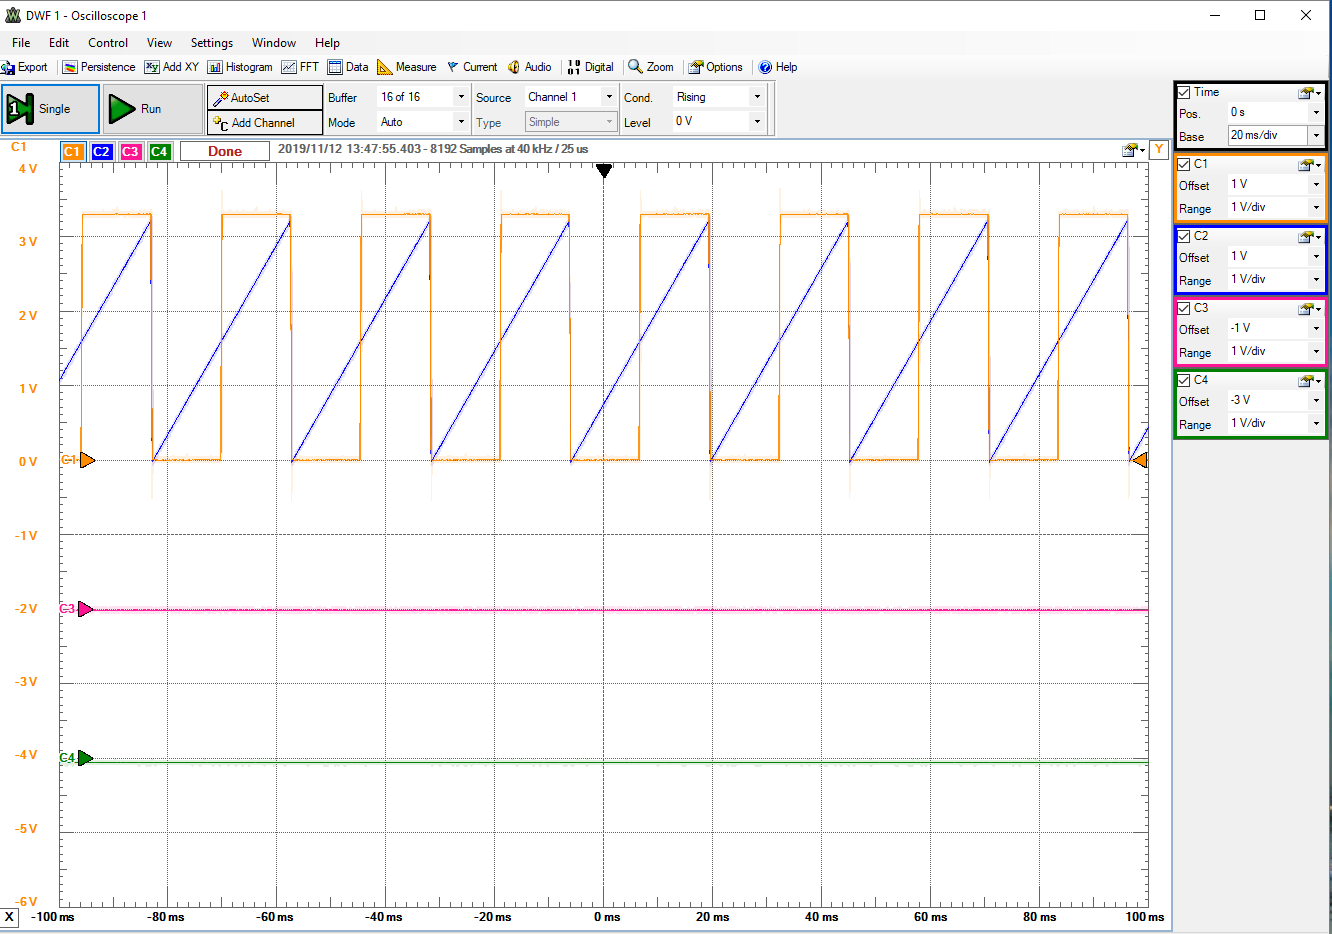
figure3:10kHZ frequency |
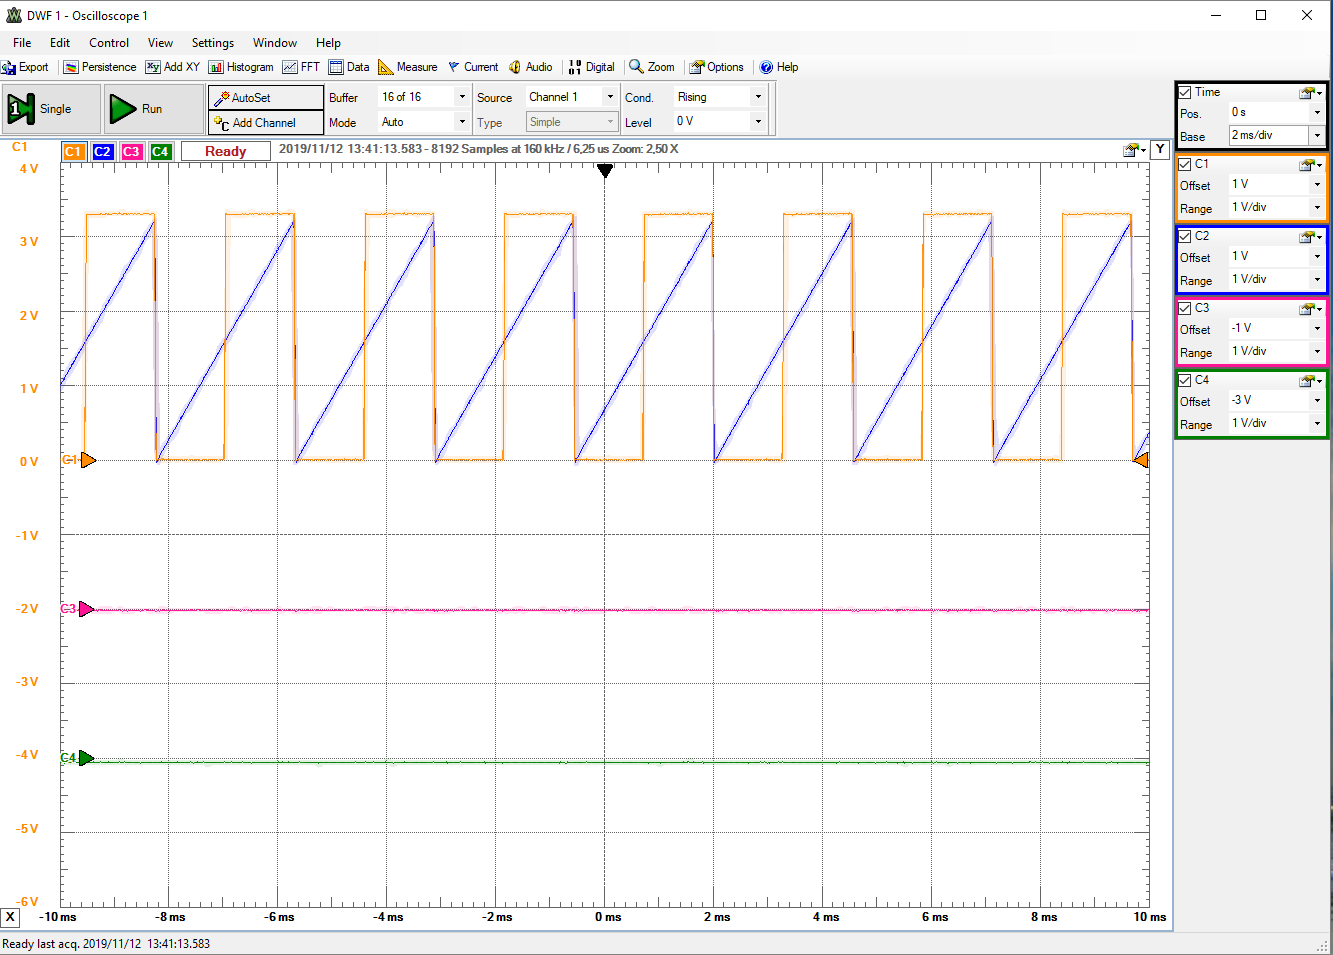
figure4: 100kHZ frequency | ||
|
We can see from the graph that the Ramp is getting bad with the increasing frequencies. We got the better results for the frequencies between 2Khz to 10Khz. |
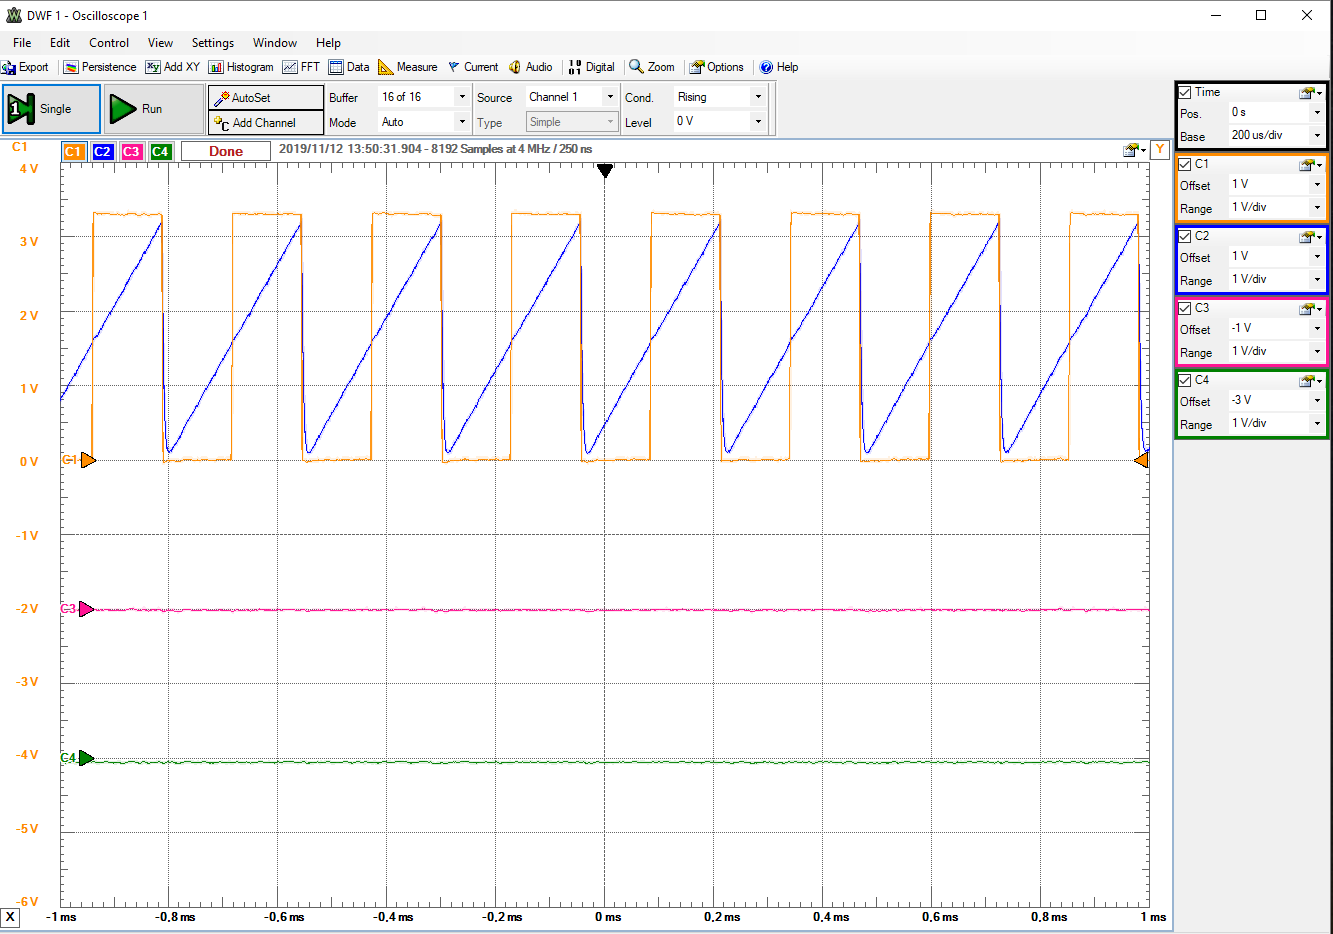
figure5:1MHZ frequency |
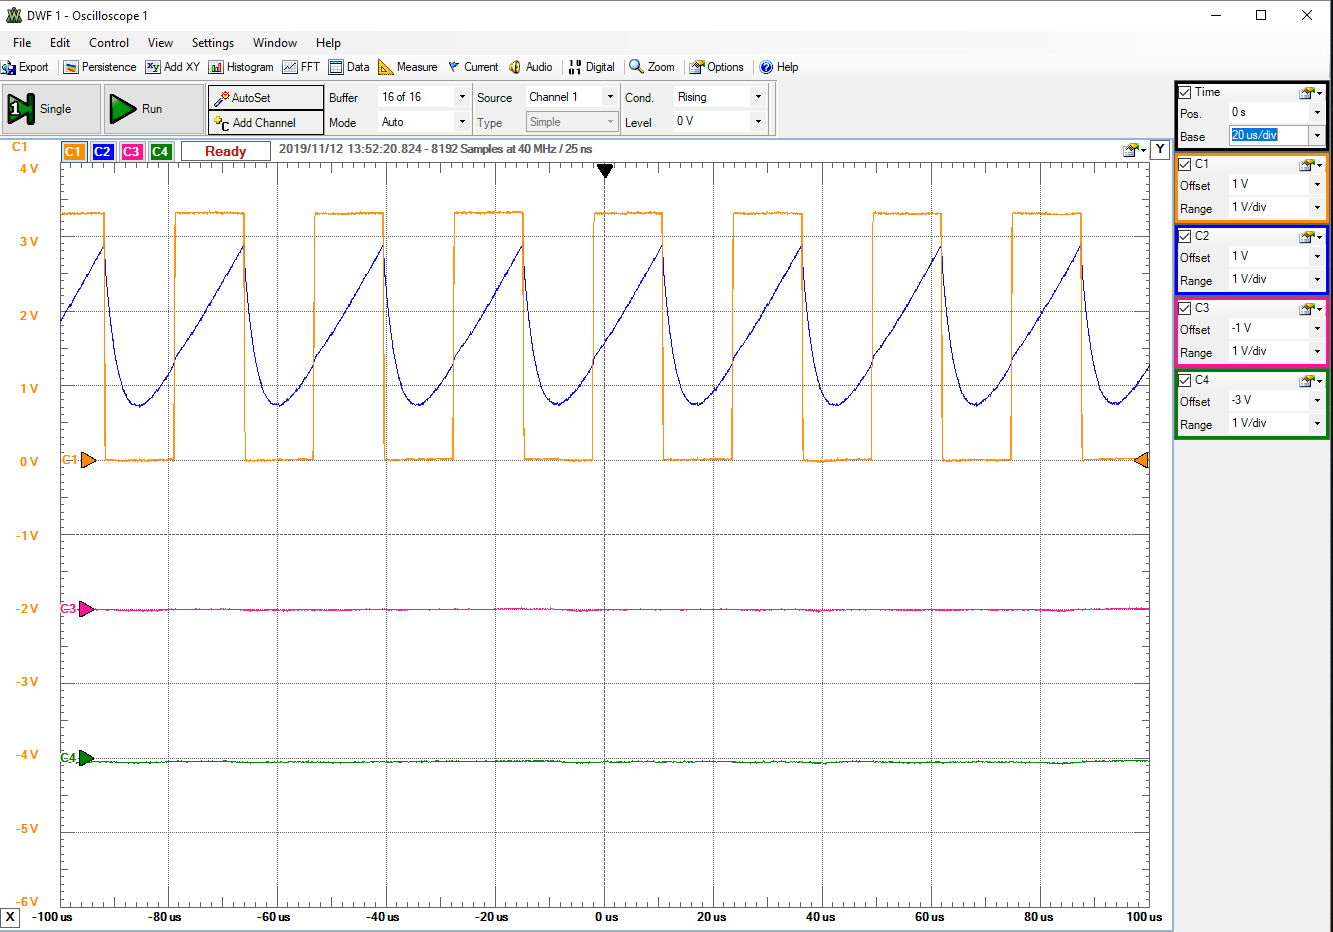
figure6:10Mhz frequency |
Settling time of the DAC
|
Settling time for the DAC is measured for both full scale and mid scale range. The figure shows the values for rising and falling edge of the clock signal. |
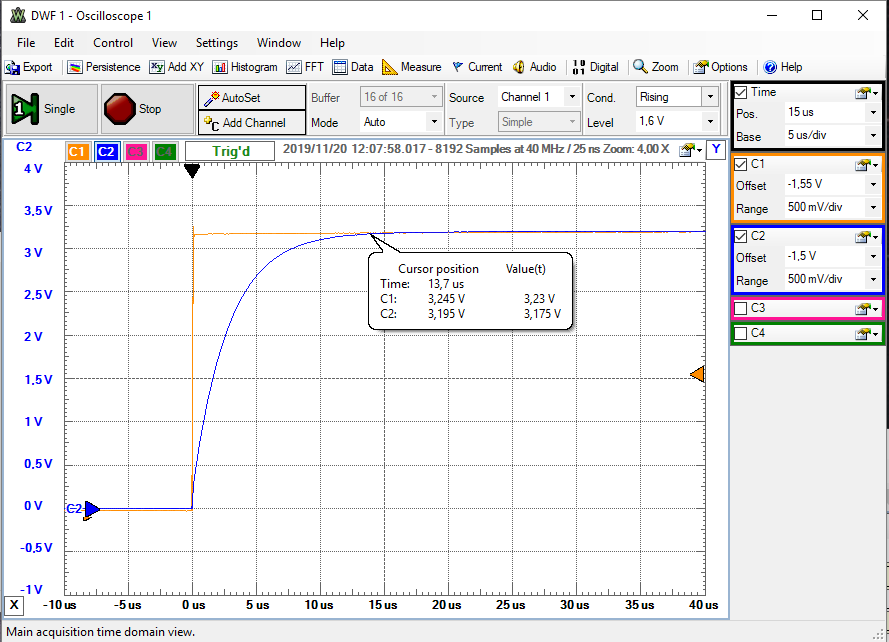
figure7: full scale rising time. |
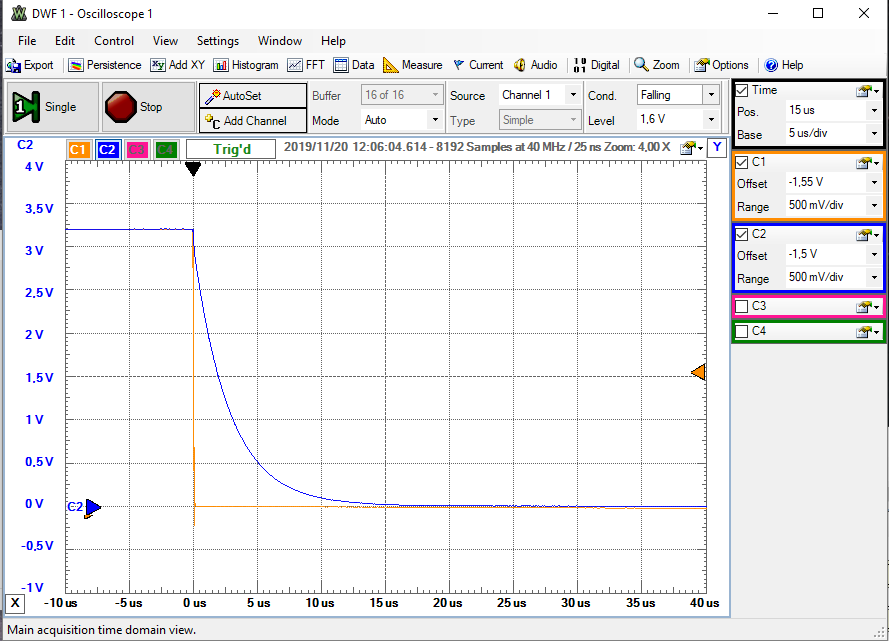
figure8:full scale falling time. | ||
|
full scale rising time=13usec full scale falling time=16usec mid scale rising time=1.5usec mid scale falling time=0.049usec |
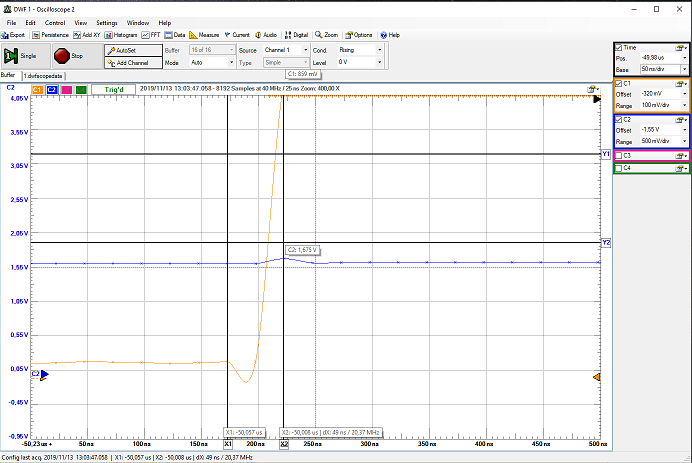
figure9:mid scale rising time |
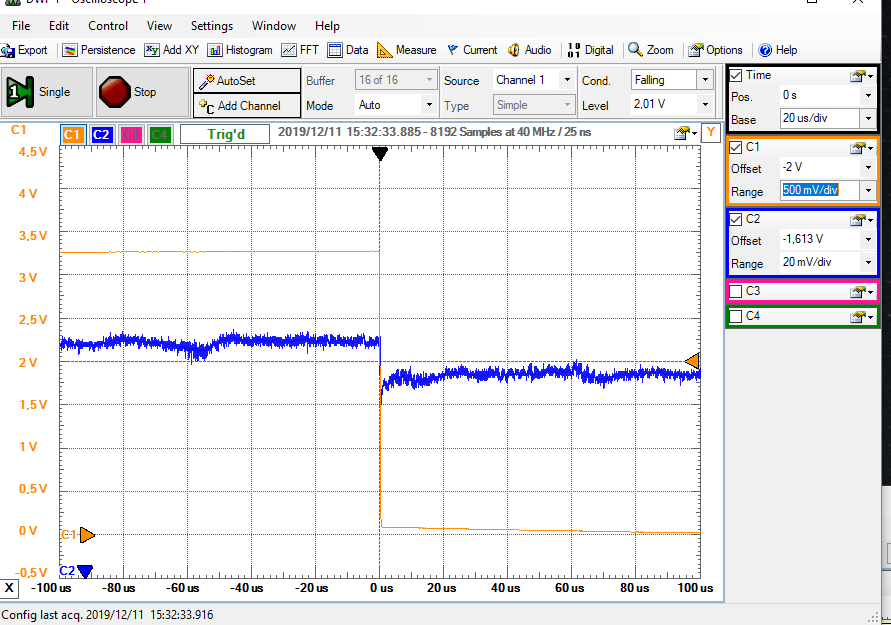
figure10:mid scale falling time |
Extraction of INL, DNL
Good extracted ramp data
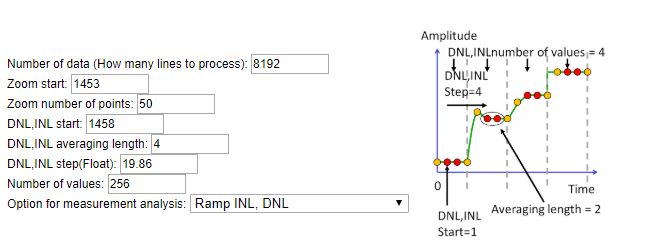
figure11 |
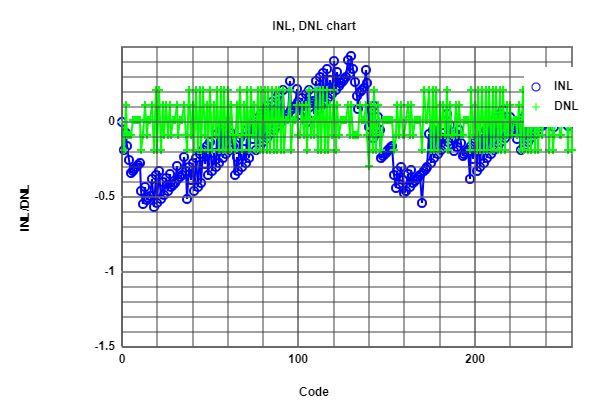
figure12: INL,DNL for 2khz frequency |
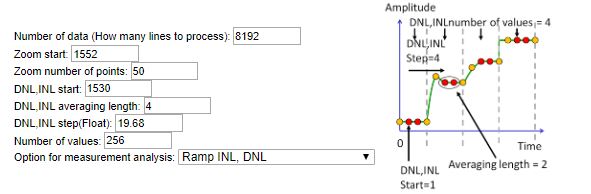
figure13 |
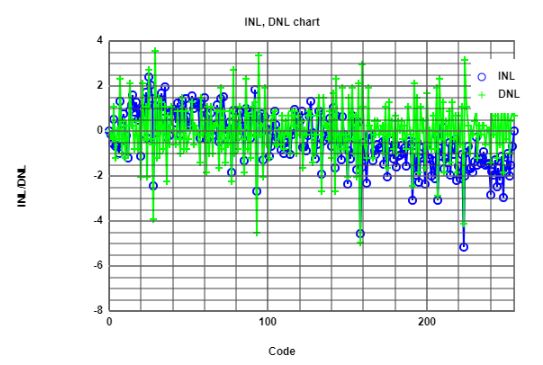
figure14:INL,DNL for 200khz frequency |
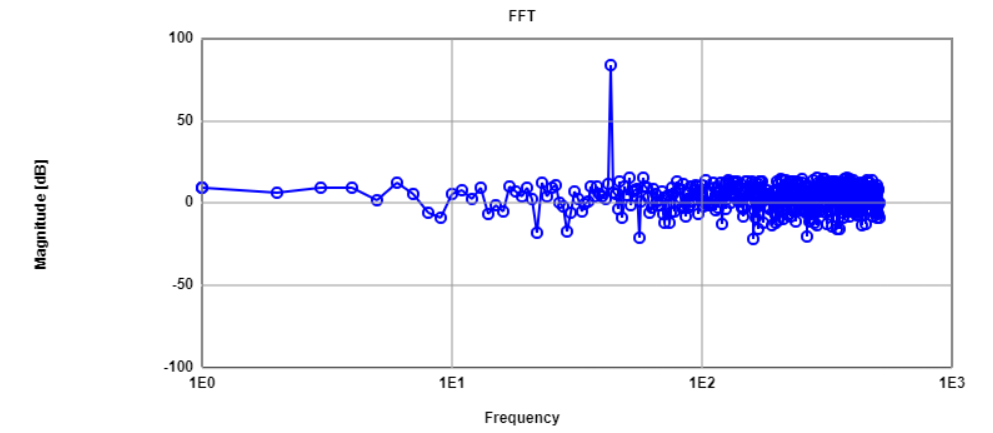
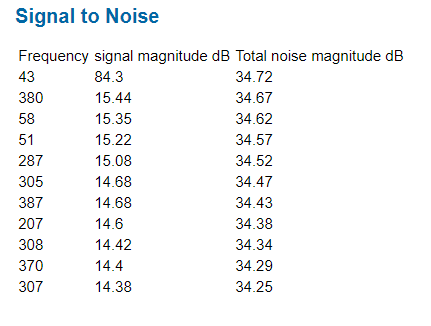
Sine measurement of R2R DAC
|
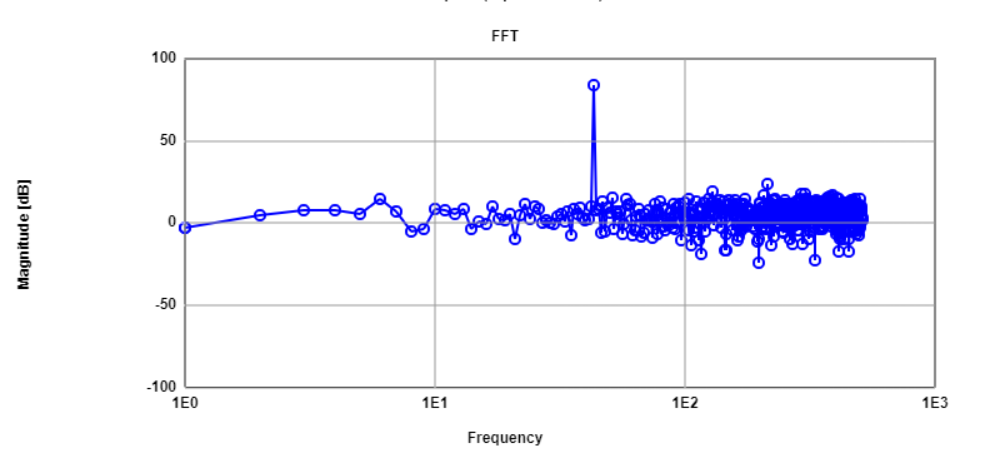
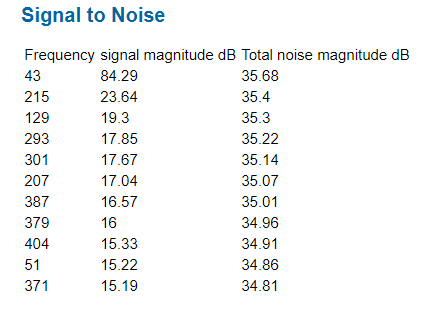
For the Sine measurement analysis of DAC we imported the 10bit sine file with 43 periods from the folder provided. The results of FFT and SNR is obtained from this. For both signals FFT shows the highest peak at around 43HZ ,but the noise level is varying. Noise level is greater for 50khz than 1khz signal. From the figure it can also be seen that ENOB= 7.9435 bits, which is less than 8 bit for 1khz signal. ENOB= 7.7823 bits, which is less than 8 bit for 50khz signal. |
|
INL, DNL measurement for different frequencies.
|
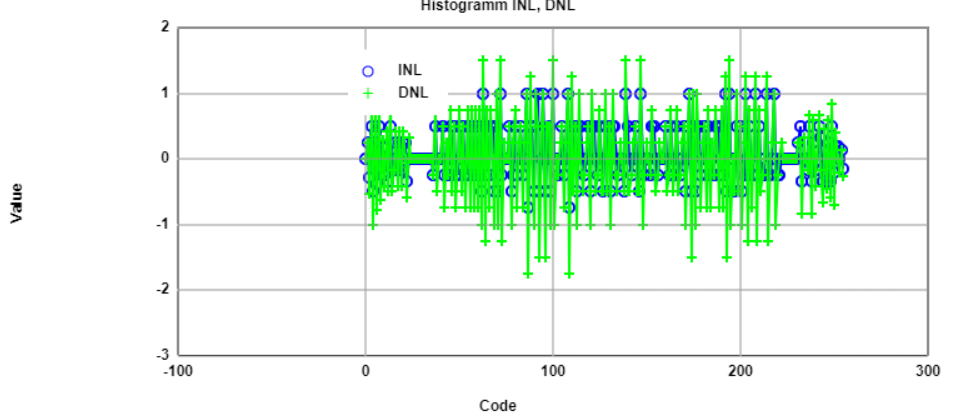
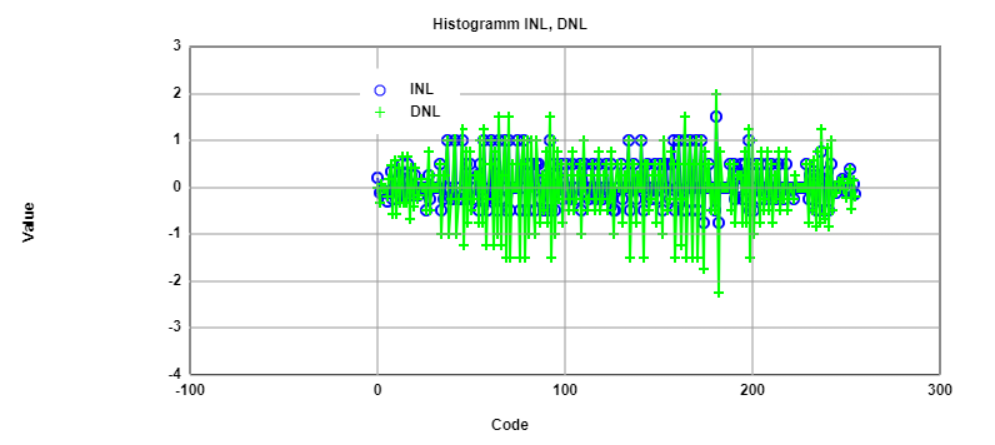
In order to get the comparison for good and bad sine measurements, we have taken two different frequencies of 1Khz and 50Khz. The results in the figure shows that, although the noise is well under the highest value but as we increase the frequencies INL,DNL is very much crossing the limits of +/- 0.5 LSB range. |
|
Digital calibrated R2R DAC
|
For the calibration of sine we used the triangular wave and used that values to get the FFT points. |
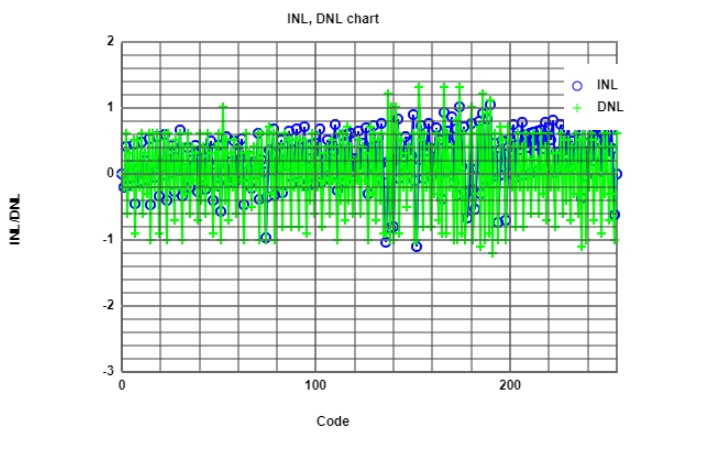
figure21 | |
|
The calibrated data shows the better results for INL,DNL values than the non calibrated data The values of INL, DNL now is in the range of +/- 0.5 LSB |
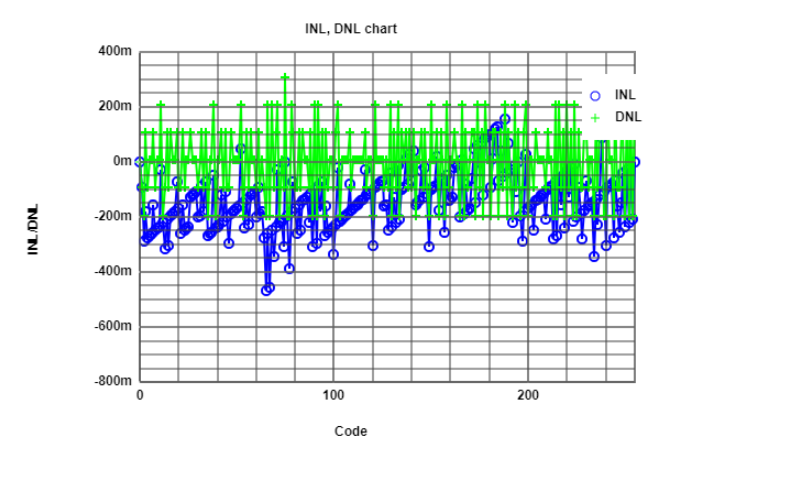
figure22 |