To test the behaviour of an ADC and DAC circuit.
We used the template from the website, which was given by the professor.
After that we simulated the schematic as you can see in Figure 1.
We used the FFT function in LTSpice.
You can find that function by klicking on View --> FFT.
Change the number of data points to 65536 and klick on okay.
The result is shown in Figure 2.
On the FFT plot you can see that input signalis displayed green,
on the other hand the output signal is tinted blue.
The big peak is the frequency of the sinusoidel signal,
which is approximately at 0dB. The SNR is in this particular case very good.
The blue curve consists of a quite higher noise, which leads to a much worse signal quality.
Now we implemented a puls voltage source to simulate the samle ADC and DAC with a ramp signal.
To do that use the following values:
Vinital = 0V; Von = 1V; Tdelay = 0s; Trise = 655.36us; Tfall = 655,36us; Ton = 0s; Tperiod = 1310.72us
Lets run the simulation again. The simulation is shown in Figure 3.
The next step was to calculate the INL, DNL with the FFT webpage.
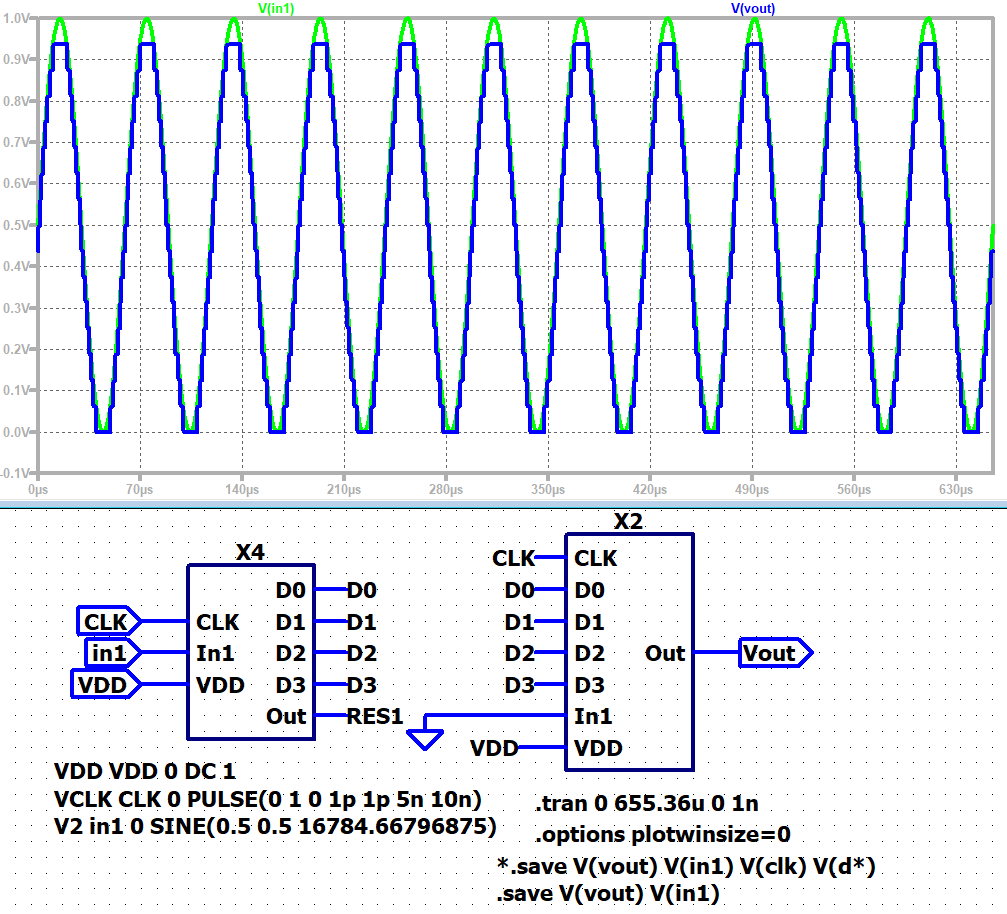
Figure 1
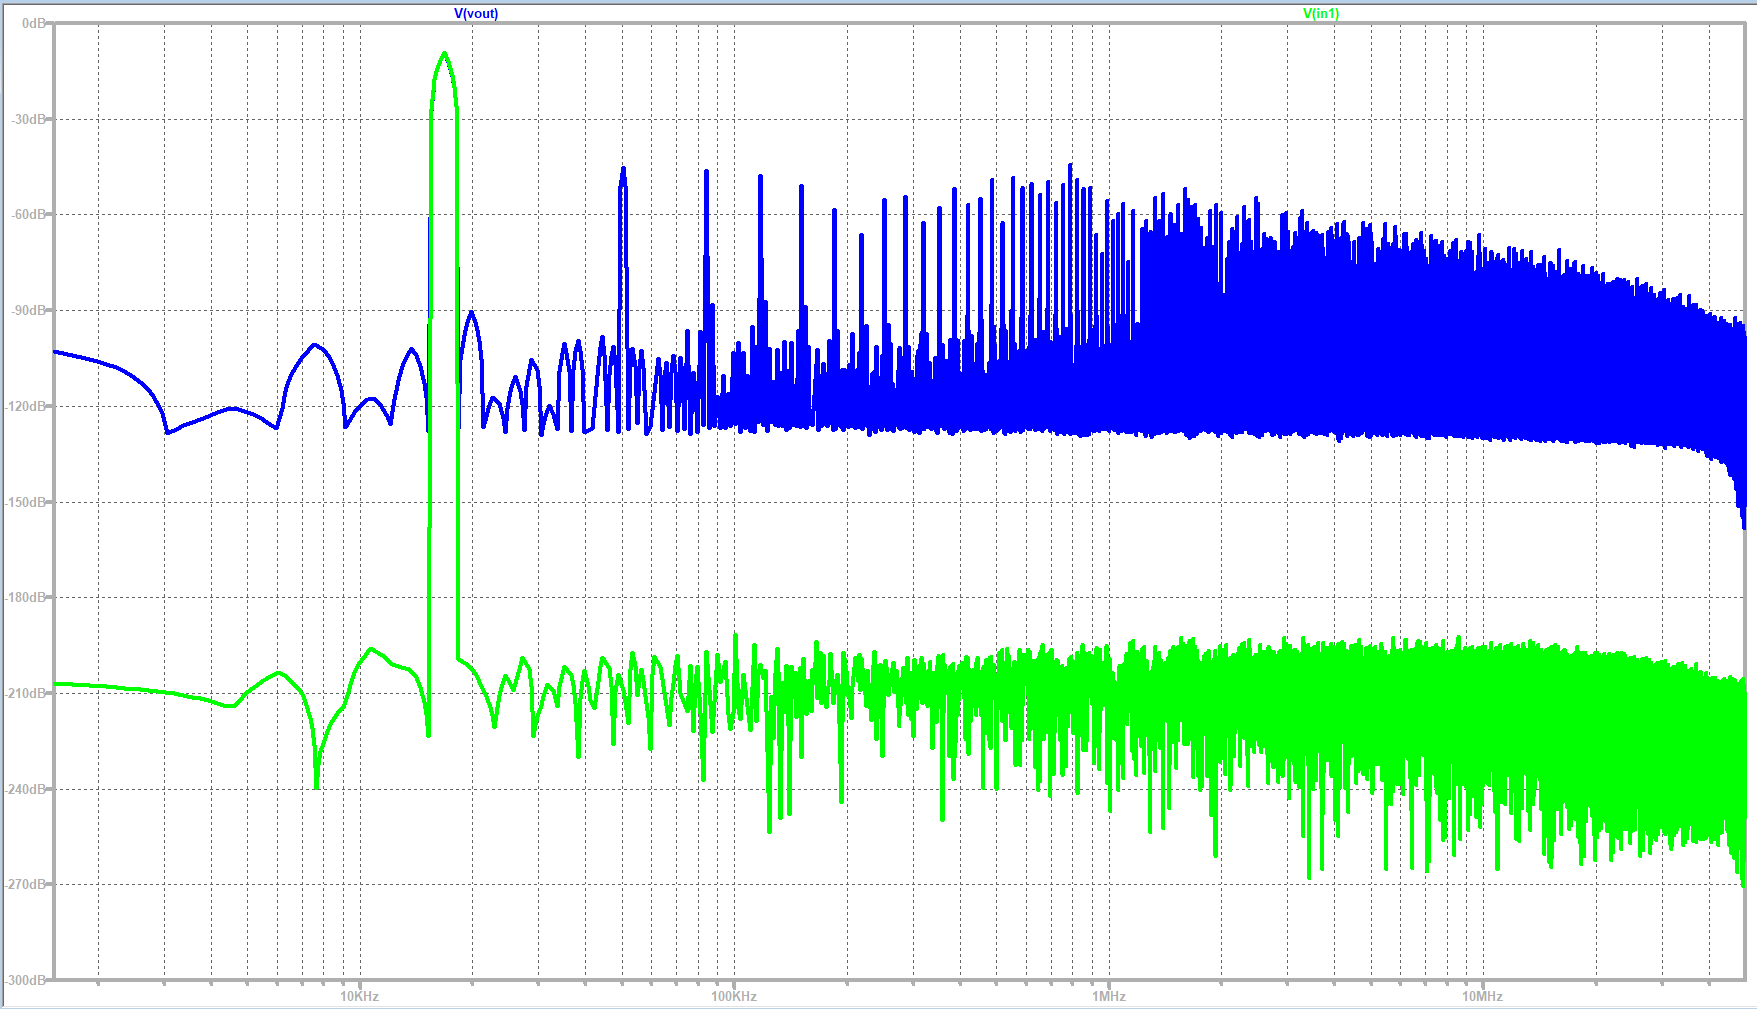
Figure 2
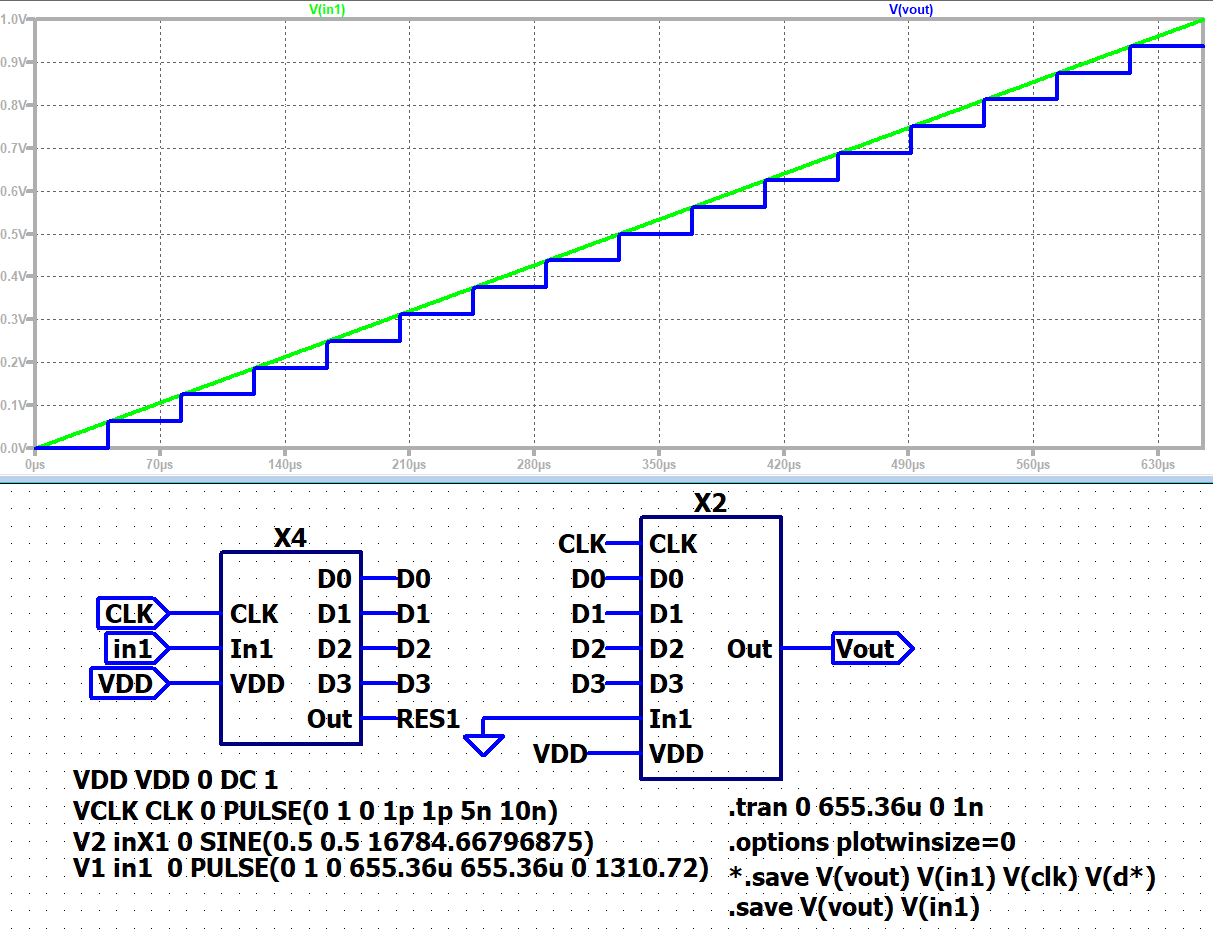
Figure 3
INL and DNL on ramp signal
We calculated the INL and the DNL by using the webpage, to see how big the error will be.
https://personalpages.hs-kempten.de/~vollratj/InEl/ReadRawFile_ADC.html.
Change the values from Start time = 0s; Stop time = 655.36us; Time step: 40.96us and upload the .raw file.
The next step is to scale the voltage values to 15 and map it to integer.
By clicking on DAC INL, DNL analysis it can be seen, that there is actually no error (seen in Figure 4).
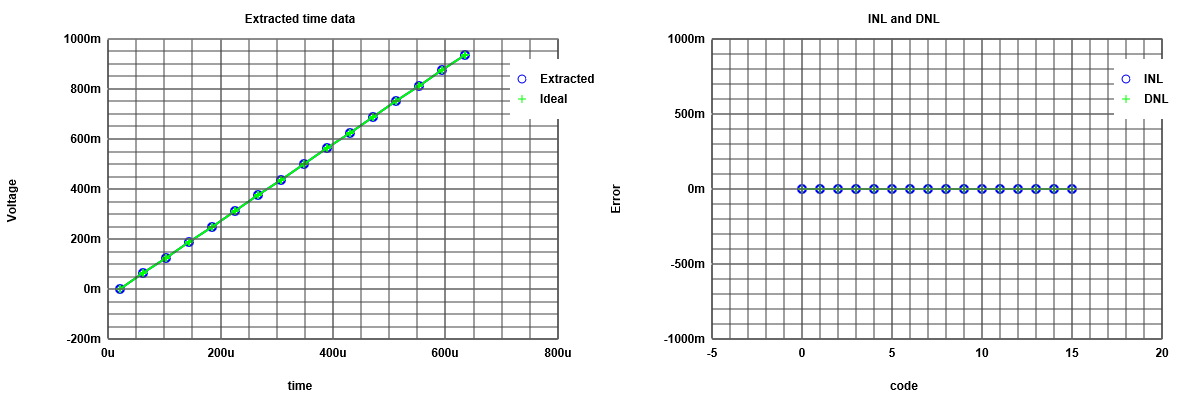
Figure 4
The seen properties are that the difference from the ideal curve to simulated curve is quite
good so the INL and DNL equals to zero.
To see the step size we changed the time step to 5.12us. Figure 5 shows the result.
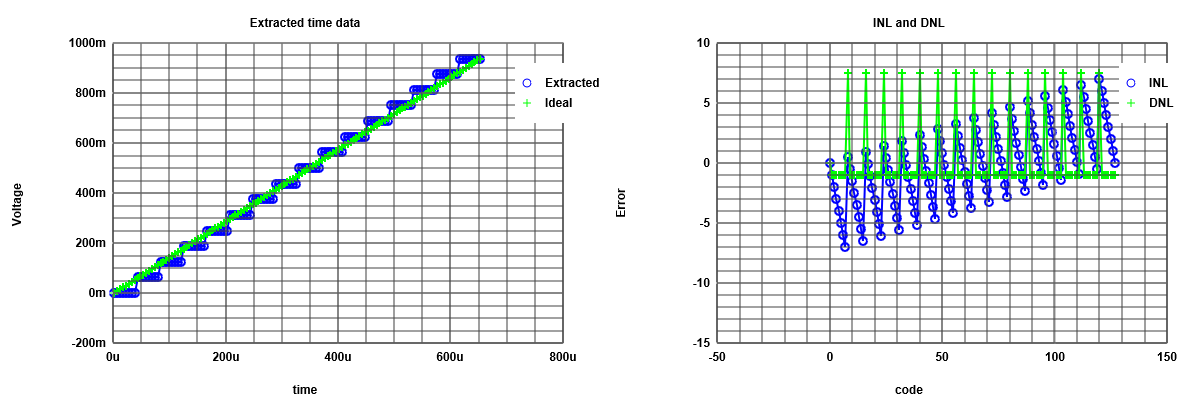
Figure 5
As seen in Figure 5 there is an error occuring between the ideal curve and the simulated curve.
Reflected is the error between the different signals in the INL and DNL which are not zero anymore.
INL and DNL on sine signal
Now we do the same test for a sin signal to calculate the INL and DNL. This reflects the difference.
The reason for this test is, that it is easier to apply a sinewave instead of an accurate linear ramp.
So there is a visible difference between INL and DNL, which leads to a non perfect sinus signal.
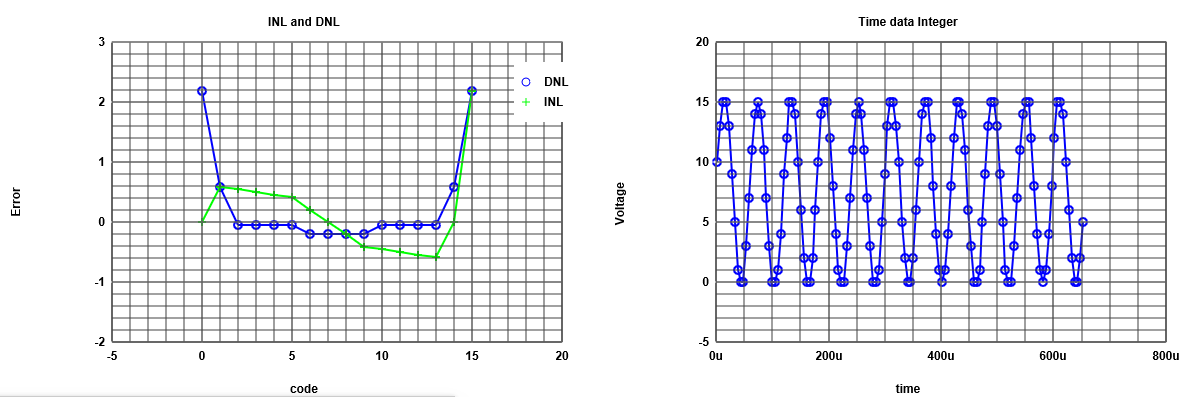
Figure 6
|
INL and DNL on sine signal
After that we used another times the integer values (sg table) to get the FFt data processing.
Now we could generate our charts (Signal, FFt, INL, DNL).
So now we can change the number of bits from 10 to 4.
The number of points is dramatically high, so the recent curve don´t show qualitatively good results.
So to decrease the number of points improve the readable result.
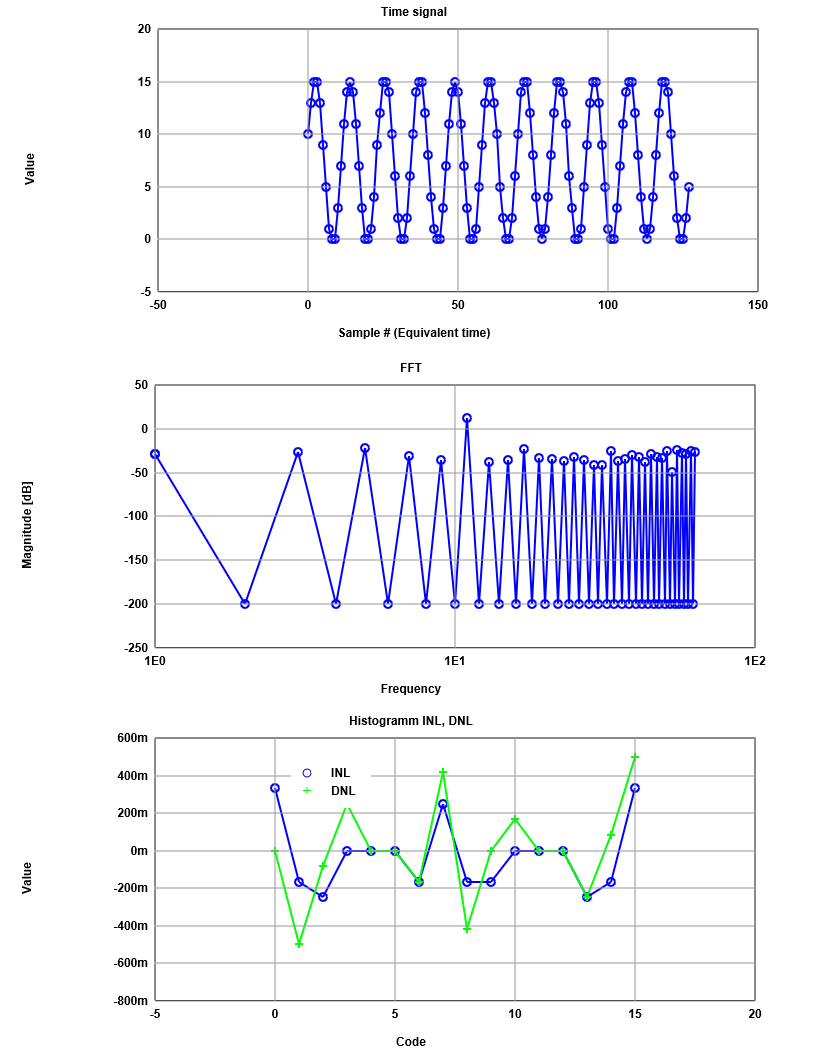
Figure 7
Then the new histogramm curve looks much more detailed.
Another advantage of this reduction is to get the real INL and DNL.
|
|
R2R DAC
First of all we copied the R2R into the ADC and DAC file.
Now we simulated with different kind of resistor values R9 from 2k to 1.5k (highest bit).
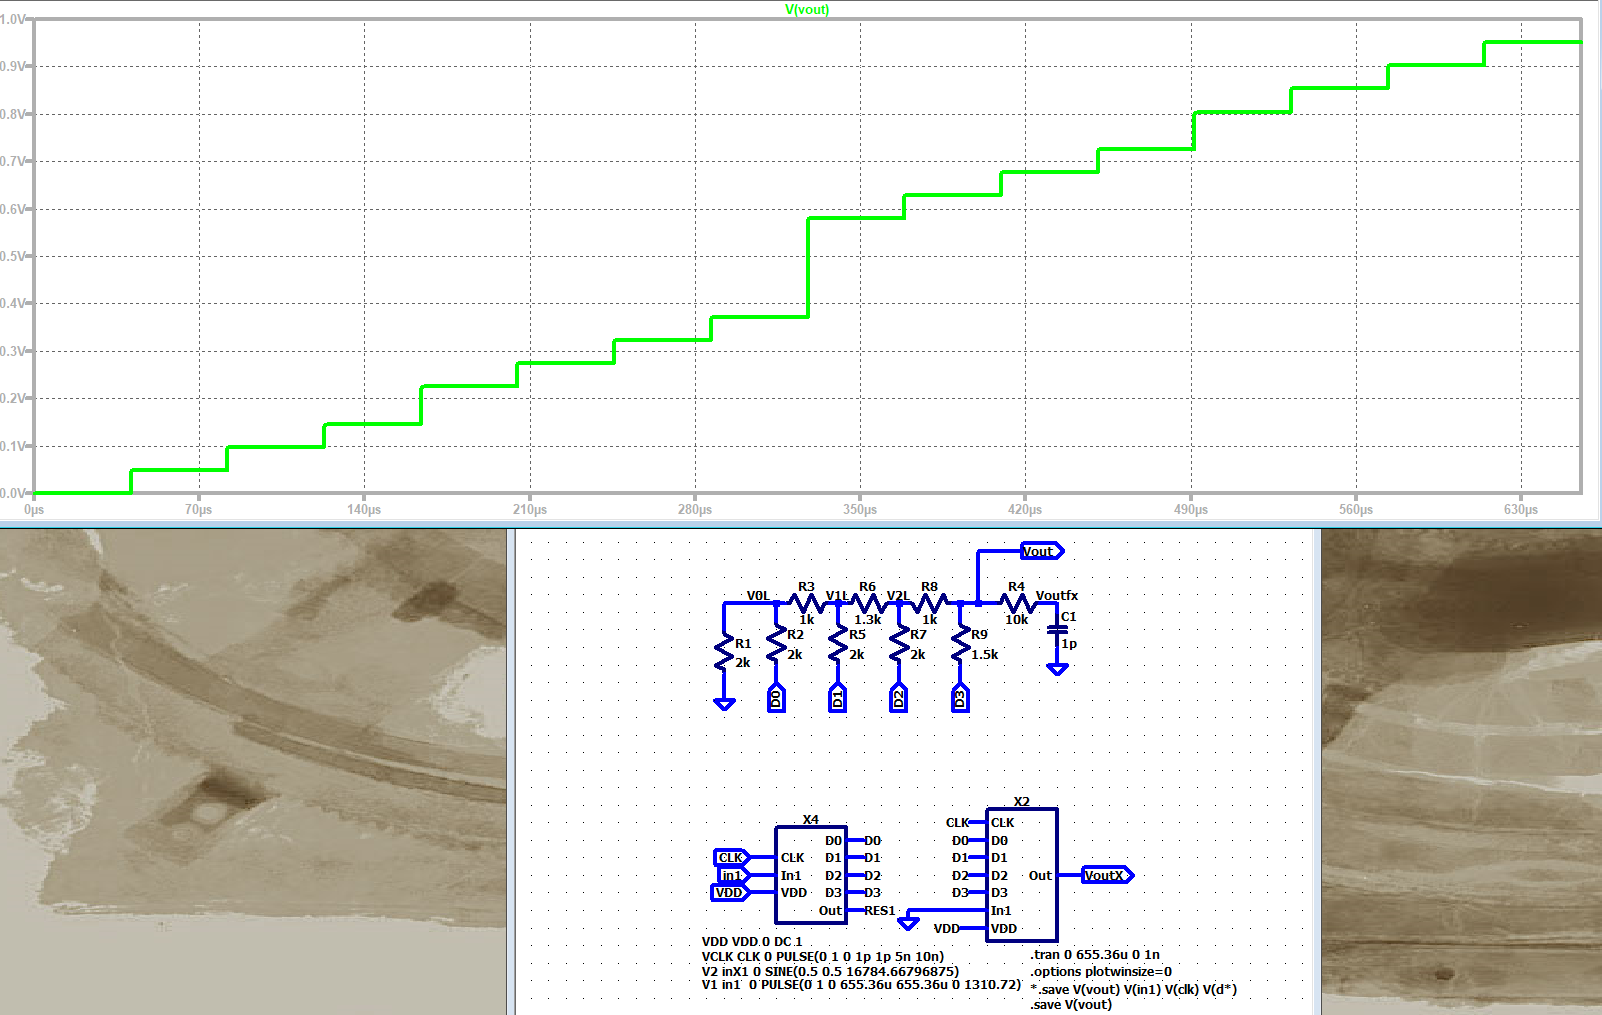
Figure 8
So we can see the non ideal stepsize especially in the middle of the curve there is huge step,
because R9 is 500ohms smaller then R2, R5 and R7.
R6 is also reduced by 700ohms.
After that we simulated again to see a non ideal DAC measurement.
It is the same procedure as we done before. So we see the FFt.
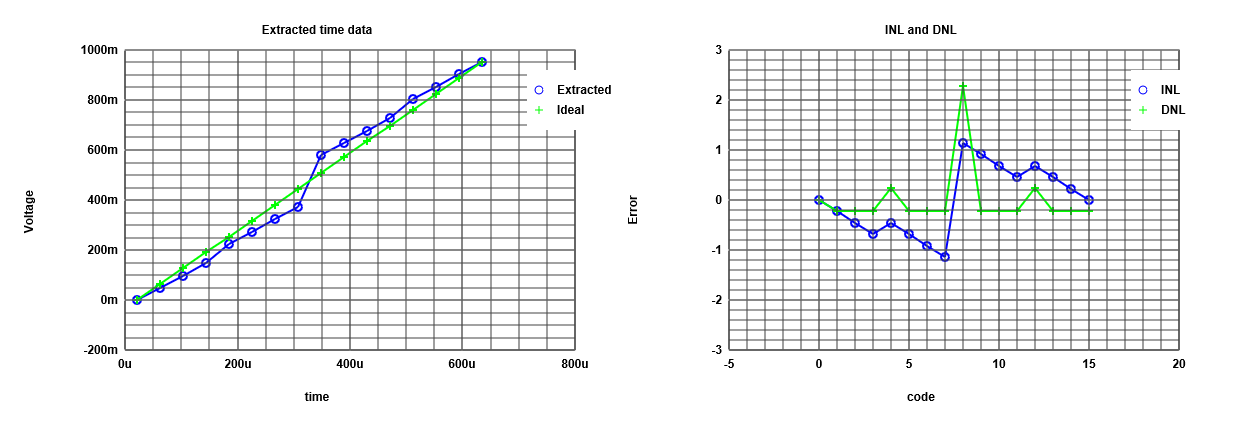
Figure 9
In Figure 9, it can be seen, that the jump of the INL and DNL matches the big jump in the LTSpice simulation.
Cause of the big step size difference, we could assume that the transformation from digital to analog is not linear.
Conclusion and Time
Conclusion
- To conclude this laboratory, it must be said, that the topic of ADC and DAC is hardly to overview.
So it was really important to get knowledge about what is INL and DNL
and what kind of parameters
we could read out of a diagram.
- Furthermore it was a really good choice of visualizing the topic.
So the effect of learning in our opinions is much more higher,
if we can see for instance using other components influences the output.
- For us, this was the first time to create something like a webpage.
For this reason it was really hard to make a proper design,
which
includes all the pictures and text.
Time
- The time effort we can split into three parts. The first part is to simulate all different kinds of exercise or problems.
So we need to get used to LTSpice to work with it in a professional manner. That was about six hours of time consuming.
- Secondly to understand the results of these simulations, we need to do quite a lot research work on the internet.
For that segment we need more time that we expected; round about five hours.
Last but not least creating the report as a webpage as well as creating the .pdf file and .zip file we needed approximately ten hours.
- To sum up it tooks us over twenty-one hours to finish this laboratory.
Notes
23/10/2019
Transfer of copyright
reade instructions on webpage
watch videos
open LTspice
implement downloded scematic in LTspice
modification of the LTspice scematic
calculate INL DNL with the FFT webpage
implement ramp signal and replace the sin signal to see the steps from the ADC
for a good ADC the the stepsize shoude be fixed
DAC every level:
Output V rising (one point) --> transfercaracteristic --> INL and DNL


ADC:
How long is the Stepsize --> Histogramm test

In LT a lot of points --> need filter --> done by java script tool (https://personalpages.hs-kempten.de/~vollratj/InEl/ReadRawFile_ADC.html)

INL DNL:
Start Time = 0sec
Stop Time = 655.36E-6sec
Time Step = 40.96E-6sec (655.36 /16) (Simulation time / number of steps)
Open .raw from LT (E:\Interface Electronics\web_Template\InEl_P2019\2019_Group_H\LTSPICE\4Bit_ADC_DAC_pipe_lab_3_ramp_sim)
wait
Possible map to integer (range 15)
Push INL and DNL (Problem: diagram not as expected --> reason: Rawdata was not corekt (V1 was also safed) --> change: .save V(vout) V(in1) into .save V(vout) in LT
DATA table:
Code, real, ideal, INL, DNL
0,0,0,0,0
1,0.0625,0.0625,0,0
2,0.125,0.125,0,0
3,0.1875,0.1875,0,0
4,0.25,0.25,0,0
5,0.3125,0.3125,0,0
6,0.375,0.375,0,0
7,0.4375,0.4375,0,0
8,0.5,0.5,0,0
9,0.5625,0.5625,0,0
10,0.625,0.625,0,0
11,0.6875,0.6875,0,0
12,0.75,0.75,0,0
13,0.8125,0.8125,0,0
14,0.875,0.875,0,0
15,0.9375,0.9375,0,0
as we are expecting ther is no error (INL and DNL = 0) becouse of the ideal curv

Histogram test:
Start Time = 0sec
Stop Time = 655.36E-6sec
Time Step = 5.12E-6sec (more time steps for Histogram 655.36/128; 16*8=128)
no different stepsize becouse it is ideal
DAC INL not unsefull (we get error) --> not interesting
DATA table:
Code, #occurence, INL, DNL
0,8,0,0
1,8,0,0
2,8,0,0
3,8,0,0
4,8,0,0
5,8,0,0
6,8,0,0
7,8,0,0
8,8,0,0
9,8,0,0
10,8,0,0
11,8,0,0
12,8,0,0
13,8,0,0
14,8,0,0
15,8,0,0


All we can do with the ram --> back to sin
Simulate in LT and load new raw data (E:\Interface Electronics\web_Template\InEl_P2019\2019_Group_H\LTSPICE\4Bit_ADC_DAC_pipe_lab_3_sine_sim)
extractet values can ben seen
Numer of level (16) (odd number of cycles)
map to int
Do Histogramm
typical curv of sine
Unforunaly this are avarage values
DATA table:
Code, #occurence, INL, DNL
0,20,2.181818181818182,0
1,10,0.5909090909090909,0.5909090909090909
2,6,-0.045454545454545435,0.5454545454545455
3,6,-0.045454545454545435,0.5000000000000001
4,6,-0.045454545454545435,0.4545454545454547
5,6,-0.045454545454545435,0.4090909090909093
6,5,-0.20454545454545453,0.20454545454545475
7,5,-0.20454545454545453,2.220446049250313e-16
8,5,-0.20454545454545453,-0.2045454545454543
9,5,-0.20454545454545453,-0.40909090909090884
10,6,-0.045454545454545435,-0.45454545454545425
11,6,-0.045454545454545435,-0.49999999999999966
12,6,-0.045454545454545435,-0.5454545454545451
13,6,-0.045454545454545435,-0.5909090909090905
14,10,0.5909090909090909,4.440892098500626e-16
15,20,2.181818181818182,2.1818181818181825
map to int:
10
13
15
15
13
9
5
1
0
0
3
7
11
14
15
14
11
7
3
0
0
1
4
9
12
15
15
14
10
6
2
0
0
2
6
10
14
15
15
12
8
4
1
0
0
3
7
11
14
15
14
11
7
3
0
0
1
5
9
13
15
15
13
10
5
2
0
0
2
6
10
14
15
15
12
8
4
1
0
1
4
8
12
15
15
14
11
6
3
0
0
1
5
9
13
15
15
13
9
5
1
0
0
3
7
11
14
15
15
12
8
4
1
0
1
4
8
12
15
15
14
10
6
2
0
0
2
5

clic on FFT data procecing
put in input data integer from above
clik on read positiv integer data
generae Charts (Bild Lab_3_sine_test_Histogramm_FFT_2)
Signal to Noise
Diffenece beweeen  +11.87dB and -13.99dB = 25.86 dB ( Getting from Signal to Noise table)
25.86 / 6 = 4.31 --> 4 Bit
Change Number of Bits from 10 to 4 --> get real INL and DNL (Lab_3_sine_test_Histogramm_FFT_2_4Bit)


Copy the R2R into the ADC DAC file (4Bit_R2R_ADC_DAC_pipe_lab_3_sine_sim)
simulate (Lab_3_4Bit_R2R_ADC_DAC_pipe_first_run)
change R values R9 from 2k to 1.5 k (highest Bit); R6 from 2k to 1.3k
simulate (Lab_3_4Bit_R2R_ADC_DAC_pipe_R_modified)
now it is not ideal anymore

In LT a lot of points --> need filter --> done by java script tool (https://personalpages.hs-kempten.de/~vollratj/InEl/ReadRawFile_ADC.html)
Start Time = 0sec
Stop Time = 655.36E-6sec
Time Step = 5.12E-6sec

make integer (15) (Bild)
sg Table:
11
13
15
15
13
10
4
1
0
0
2
6
11
14
15
14
11
6
2
0
0
1
4
10
13
15
15
14
11
5
2
0
0
2
5
11
14
15
15
13
9
4
1
0
0
2
6
11
14
15
14
11
6
2
0
0
1
4
10
13
15
15
13
11
4
2
0
0
2
5
11
14
15
15
13
9
4
1
0
1
4
9
13
15
15
14
11
5
2
0
0
1
4
10
13
15
15
13
10
4
1
0
0
2
6
11
14
15
15
13
9
4
1
0
1
4
9
13
15
15
14
11
5
2
0
0
2
4

FFT and values of Sg table in Input data
Number of points: 128
Number of bits: 4
Number of frequencies... : 10
read positiv int
Generate Charts

Time signal Char --> something is missing
FFT --> Harmonics are visuable; signal to noise
Histogramm INL, DNL --> a lot of errors
??no error in the center
Signal to Noise
Frequ.  sig. mag.    noise mag.
11      12.09       -6.75

distance +12.09 to -6.75 is 18.84
18.74 / 6 = 3.14 --> 3 Bit


Ramp Test:
enable V1
disable V2
simulate
Stepsize is different (Lab_3_4Bit_R2R_ADC_DAC_pipe_R_modified_ramp)
Start Time = 0sec
Stop Time = 655.36E-6sec
Time Step = 40.96E-6sec
Lode E:\Interface Electronics\web_Template\InEl_P2019\2019_Group_H\LTSPICE\4Bit_R2R_ADC_DAC_pipe_lab_3_ramp_sim in (https://personalpages.hs-kempten.de/~vollratj/InEl/ReadRawFile_ADC.html)
big jump is Highest Bit
lower jumps are low order Bits
sgTable:
Code, real, ideal, INL, DNL
0,0,0,0,0
1,0.048859935253858566,0.06340933640797933,-0.22945203306511638,-0.22945203306511638
2,0.09771987050771713,0.12681867281595865,-0.45890406613023277,-0.22945203306511638
3,0.1465798020362854,0.19022800922393798,-0.6883561579452196,-0.22945209181498682
4,0.22475570440292358,0.2536373456319173,-0.4554793168496131,0.23287684109560647
5,0.27361562848091125,0.3170466820398966,-0.6849315261643404,-0.2294522093147277
6,0.3224755823612213,0.38045601844787596,-0.9143832654801051,-0.2294517393157642
7,0.371335506439209,0.4438653548558553,-1.1438354747948331,-0.2294522093147277
8,0.579804539680481,0.5072746912638346,1.1438354747948331,2.287670949589666
9,0.628664493560791,0.5706840276718139,0.9143837354790694,-0.2294517393157642
10,0.6775244474411011,0.6340933640797932,0.6849319961633057,-0.2294517393157642
11,0.7263843417167664,0.6975027004877726,0.4554793168496131,-0.2294526793136912
12,0.8045602440834045,0.7609120368957519,0.6883561579452201,0.23287684109560647
13,0.8534201979637146,0.8243213733037312,0.4589044186294563,-0.2294517393157642
14,0.9022801518440247,0.8877307097117106,0.22945267931369076,-0.2294517393157642
15,0.9511400461196899,0.9511400461196899,0,-0.2294526793136912


Extraxt data from LT (LTspice help)
Edit-->Spice DirectiveS
.meas trans CUT00 V(vout) AT=20.48us (Wrong)
View --> Spice Error Log
Circuit: * E:\Interface Electronics\web_Template\InEl_P2019\2019_Group_H\LTSPICE\4Bit_R2R_ADC_DAC_pipe_lab_3_ramp_2_sim.asc

WARNING: Less than two connections to node RES1.  This node is used by B:X4:5.
WARNING: Less than two connections to node INX1.  This node is used by V2.
Direct Newton iteration for .op point succeeded.

trans: (null)=(null) AT 2.048e-005


Date: Thu Oct 24 12:46:33 2019
Total elapsed time: 28.158 seconds.

tnom = 27
temp = 27
method = modified trap
totiter = 7293429
traniter = 7293426
tranpoints = 3581133
accept = 3328663
rejected = 252470
matrix size = 29
fillins = 0
solver = Normal
Matrix Compiler1: 864 bytes object code size  0.3/0.2/[0.1]
Matrix Compiler2: 2.04 KB object code size  0.1/0.2/[0.1]


.meas trans OUT00 FIND V(vout) AT=20.48us (write)
View --> Spice Error Log
Circuit: * E:\Interface Electronics\web_Template\InEl_P2019\2019_Group_H\LTSPICE\4Bit_R2R_ADC_DAC_pipe_lab_3_ramp_2_sim.asc

WARNING: Less than two connections to node RES1.  This node is used by B:X4:5.
WARNING: Less than two connections to node INX1.  This node is used by V2.
Direct Newton iteration for .op point succeeded.

trans: v(vout)=0 at 2.048e-005


Date: Thu Oct 24 12:53:25 2019
Total elapsed time: 27.647 seconds.

tnom = 27
temp = 27
method = modified trap
totiter = 7293429
traniter = 7293426
tranpoints = 3581133
accept = 3328663
rejected = 252470
matrix size = 29
fillins = 0
solver = Normal
Matrix Compiler1: 864 bytes object code size  0.2/0.1/[0.1]
Matrix Compiler2: 2.04 KB object code size  0.1/0.2/[0.1]

change time to higher value (81.92us)

Circuit: * E:\Interface Electronics\web_Template\InEl_P2019\2019_Group_H\LTSPICE\4Bit_R2R_ADC_DAC_pipe_lab_3_ramp_2_sim.asc

WARNING: Less than two connections to node RES1.  This node is used by B:X4:5.
WARNING: Less than two connections to node INX1.  This node is used by V2.
Direct Newton iteration for .op point succeeded.

trans: v(vout)=0.0488599 at 8.192e-005

Date: Thu Oct 24 12:55:33 2019
Total elapsed time: 24.809 seconds.

tnom = 27
temp = 27
method = modified trap
totiter = 7293429
traniter = 7293426
tranpoints = 3581133
accept = 3328663
rejected = 252470
matrix size = 29
fillins = 0
solver = Normal
Matrix Compiler1: 864 bytes object code size  0.3/0.1/[0.1]
Matrix Compiler2: 2.04 KB object code size  0.1/0.2/[0.1]

Execute all measurements
File --> Execute.Meas SCRIPT
|
|
|