FFT (Fast Fourier Transformation)
02.12.2022 Joerg Vollrath
+ Share page with QR-code
- Share page with QR-code
Today we want to look at the FFT tab in EEBench.
User interface
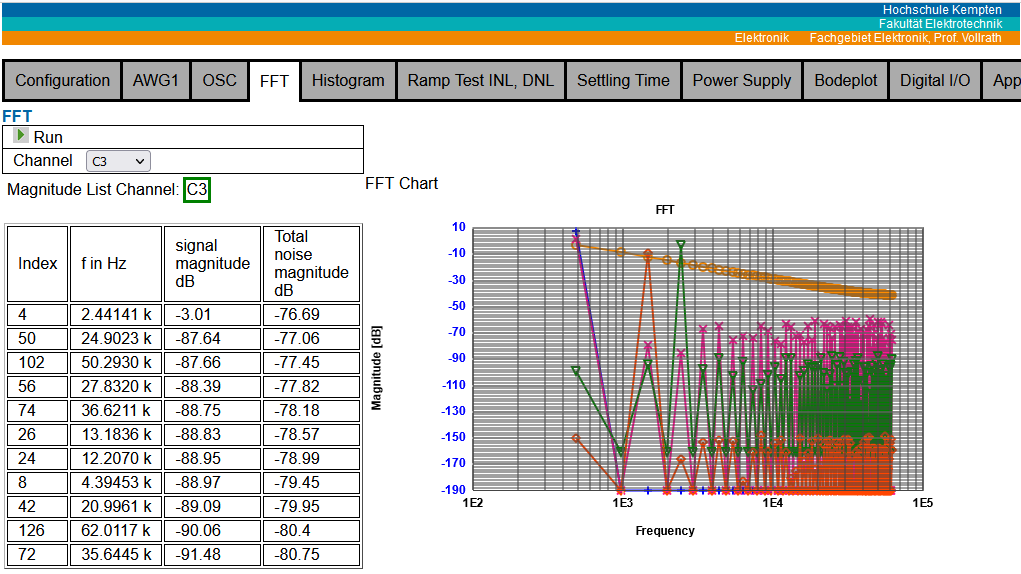
Figure: FFT tab
The user interface shows the 'Run' button, 'Channel' selection for the magnitude list,
a magnitude list and the display of the FFT of all selected channels.
FFT data (array betragdB) of active channels (array dataOSC2) plotting can be done by chart.js
For fft function dspFFT.js is used:
Spectrum Analyzer.
For a class about data converters'Interface Electronics' a browser based
FFT tool was realized,
which can be used as starting point for SNR calculation and table creation.
Layout
The 'Run' button and channel selection list is placed on top of the page.
<table class="bx">
 <tr><td class="bo">
     <span id="fRun"  style="display:block" onclick="generateFFT()"><img src="ImagesS/Run.png" width="16"> Run  </span>
     <span id="fStop" style="display:none"  onclick="fOp('Stop')"><img src="ImagesS/Stop.png" width="16"> Stop </span> </td>
 </tr>
 <tr>
   <td class="bo">Channel
      <select name="fftSrc" id="fftSrc" onclick="calcHarmonics()">
       <option value="1"> AWG1 </option>
       <option value="2"> C1 </option>
       <option value="3"> C2 </option>
       <option value="4"> C3 </option>
       <option value="5"> C4 </option>
	  </select>
   </td>
 </tr>
Only one list of SNR ratios for the active curve is shown, but FFTs for all curves
are calculated and displayed.
From the example file FFT_Javascript_2017_Calibration.html the
following functions were copied:
function nextPwrOf2(n)
function nutall(nPair)  { // Nutall window
function blackman(nPair) { // Blackman window
function hamming(nPair) { // Hamming window
function calcHarmonics() {  // List of harmonics
function generateFFT() {    // Calculate and display FFT
After a review some code was updated for consistency of naming conventions.
The function calcHarmonics was extracted from generateFFT to be able to change the channel
for the list of shown SNR ratios.
The ScatterPlot function was updated to ScatterPlotO to display consistent
colors according to the oscilloscope.
Scaling of axis had to be changed, since now the x-axis is logarithmic
and all curves have the same scaling.
Test of FFT function
A button with a function
function generateData() {
implemented at the oscilloscop tab was used to
generated a base set of data which can then be analyzed with FFT and used for test.
Only active channels are displayed in the FFT window.
Correct values were checked with the harmonics list and the SNR ratio.
A live acquisition was then done with AWG1 at signal frequency = 2.00 kHz, amplitude 1 V
and offset 1 V.
The FFT showed the expected signal level but a lot of bleeding of the signal.
The signal to noise ratio was very bad.
First try was to adjust the frequency and step size to get an integer number of periods during
acquisition.
Former experience
(FFT_Javascript_2017_Calibration.html,
Sine signal and FFT playground)
showed not optimum SNRs using windowing.
The limited precision (3) of the input fields of signal frequency at first limited step size
resolution and was increased to 6.
function valueToUnit(val) {
..
    return (val*scale).toPrecision(6) + " " + mod;
}
For a 16-Bit DAC digital code generator a maximum SNR of -40 dB was achieved
with the signal frequency of 2.3500 kHz.
This is far from the expected 16*6.02 dB = 96 dB.
A short experiment with Sine signal (5 amplitude) and FFT playground showed with a 256 FFT points and a
signal length variation from 4.. .115 points the resulting frequency, signal magnitude and noise magnitude.
| Period length | frequency | signal magnitude dB | noise magnitude dB |
| 8 | 32 | 10.97 | -270.31 |
| 9 | 28 | 7.97 | 10.96 |
| 10 | 26 | 8.48 | 10.34 |
| 11 | 23 | 9.86 | 7.46 |
| 12 | 21 | 9.32 | 8.98 |
| 13 | 20 | 9.52 | 8.42 |
| 14 | 18 | 9.75 | 7.82 |
| 15 | 17 | 10.89 | -4.38 |
| 16 | 16 | 10.97 | -275.74 |
| 17 | 15 | 10.9 | -5.46 |
| 18 | 14 | 10.22 | 5.84 |
| 19 | 13 | 7.62 | 11.29 |
| 20 | 13 | 10.39 | 4.94 |
| 21 | 12 | 10.4 | 4.58 |
| 22 | 12 | 8.88 | 9.7 |
| 23 | 11 | 10.68 | 1.41 |
| 24 | 11 | 9.22 | 9.05 |
| 25 | 10 | 10.1 | 6.46 |
| 26 | 10 | 10.65 | 2.73 |
| 27 | 9 | 7.57 | 11.34 |
| 28 | 9 | 10.62 | 2.19 |
| 29 | 9 | 10.56 | 3.69 |
| 30 | 9 | 7.36 | 11.46 |
| 31 | 8 | 9.98 | 7.02 |
| 32 | 8 | 10.97 | -279.99 |
| 33 | 8 | 10.09 | 6.52 |
| 34 | 8 | 7.27 | 11.54 |
| 35 | 7 | 9.55 | 8.49 |
| 36 | 7 | 10.73 | 0.06 |
| 37 | 7 | 10.91 | -2.74 |
| 38 | 7 | 9.92 | 7.19 |
| 39 | 7 | 7.78 | 11.06 |
| 40 | 6 | 8.75 | 10.12 |
| 41 | 6 | 10.07 | 6.58 |
| 42 | 6 | 10.78 | -1.26 |
| 43 | 6 | 10.97 | -7.53 |
| 44 | 6 | 10.53 | 4.11 |
| 45 | 6 | 9.42 | 8.55 |
| 46 | 6 | 7.76 | 11.07 |
| 47 | 5 | 8.23 | 10.76 |
| 48 | 5 | 9.43 | 8.87 |
| 49 | 5 | 10.18 | 5.93 |
| 50 | 5 | 10.68 | 0.74 |
| 51 | 5 | 10.95 | -14.97 |
| 52 | 5 | 10.94 | -3.21 |
| 53 | 5 | 10.61 | 3.53 |
| 54 | 5 | 9.95 | 7.06 |
| 55 | 5 | 8.99 | 9.39 |
| 56 | 5 | 7.79 | 11.01 |
| 57 | 4 | 7.68 | 11.25 |
| 58 | 4 | 8.71 | 10.22 |
| 59 | 4 | 9.42 | 8.95 |
| 60 | 4 | 9.93 | 7.25 |
| 61 | 4 | 10.32 | 4.89 |
| 62 | 4 | 10.62 | 1.38 |
| 63 | 4 | 10.85 | -4.74 |
| 64 | 4 | 10.97 | -283.36 |
| 65 | 4 | 10.97 | -5.13 |
| 66 | 4 | 10.85 | 0.66 |
| 67 | 4 | 10.58 | 3.96 |
| 68 | 4 | 10.17 | 6.25 |
| 69 | 4 | 9.63 | 7.99 |
| 70 | 4 | 8.98 | 9.36 |
| 71 | 4 | 8.24 | 10.45 |
| 72 | 4 | 7.43 | 11.32 |
| 73 | 3 | 7.58 | 11.3 |
| 74 | 3 | 8.28 | 10.73 |
| 75 | 3 | 8.82 | 10.1 |
| 76 | 3 | 9.25 | 9.4 |
| 77 | 3 | 9.58 | 8.59 |
| 78 | 3 | 9.86 | 7.63 |
| 79 | 3 | 10.09 | 6.46 |
| 80 | 3 | 10.29 | 5.03 |
| 81 | 3 | 10.46 | 3.24 |
| 82 | 3 | 10.62 | 0.93 |
| 83 | 3 | 10.76 | -2.24 |
| 84 | 3 | 10.87 | -7.21 |
| 85 | 3 | 10.95 | -19.39 |
| 86 | 3 | 10.99 | -13.52 |
| 87 | 3 | 11 | -5.72 |
| 88 | 3 | 10.96 | -1.81 |
| 89 | 3 | 10.87 | 0.79 |
| 90 | 3 | 10.74 | 2.74 |
| 91 | 3 | 10.56 | 4.28 |
| 92 | 3 | 10.33 | 5.56 |
| 93 | 3 | 10.07 | 6.65 |
| 94 | 3 | 9.76 | 7.59 |
| 95 | 3 | 9.42 | 8.42 |
| 96 | 3 | 9.04 | 9.16 |
| 97 | 3 | 8.64 | 9.81 |
| 98 | 3 | 8.22 | 10.39 |
| 99 | 3 | 7.78 | 10.9 |
| 100 | 3 | 7.32 | 11.35 |
| 101 | 2 | 7.37 | 11.38 |
| 102 | 2 | 7.8 | 11.09 |
| 103 | 2 | 8.18 | 10.79 |
| 104 | 2 | 8.5 | 10.5 |
| 105 | 2 | 8.78 | 10.2 |
| 106 | 2 | 9.01 | 9.89 |
| 107 | 2 | 9.22 | 9.58 |
| 108 | 2 | 9.39 | 9.25 |
| 109 | 2 | 9.54 | 8.89 |
| 110 | 2 | 9.67 | 8.51 |
| 111 | 2 | 9.78 | 8.09 |
| 112 | 2 | 9.88 | 7.64 |
| 113 | 2 | 9.98 | 7.14 |
| 114 | 2 | 10.06 | 6.59 |
| 115 | 2 | 10.14 | 5.99 |
| 119 | 2 | 10.44 | 2.81 |
| 120 | 2 | 10.52 | 1.76 |
| 123 | 2 | 10.72 | -2.48 |
| 125 | 2 | 10.84 | -7.07 |
| 126 | 2 | 10.89 | -10.68 |
| 127 | 2 | 10.93 | -16.79 |
| 128 | 2 | 10.97 | -283.92 |
| 128 | -18 | 0 | 0 |
The signal amplitude has a maximum of 10.97 dB and
noise magnitude goes down to -270 dB for period length of 4,8,16,32 and 64.
Effective number of bits is ENOB = (10.97 dB - (-270 dB) / 6 dB = 47.
(A 64 Bit floating point number has 1 sign bit, 11 exponent bis and 52 fraction bits.)
In between bleeding can be seen reducing the signal to noise margin.
A non-integer number of periods causes a jump at the end of the FFT points.
For period length of 85 (-19 dB noise, 256/3), 51 (-15 dB, 256/5),
43 (-7.5, dB 256/6) and 37 (-2.7 dB, 256/7) the
period nearly fits to the 256 points and bleeding and noise level is reduced.
For the remaining cases a signal to noise ratio less than 5 dB can be seen.
Windowing
Windowing can be used to estimate signal to noise ratio with non integer number of periods.
The signal will be distributed to more bins (see next figure) and the signal to noise ratio improves.
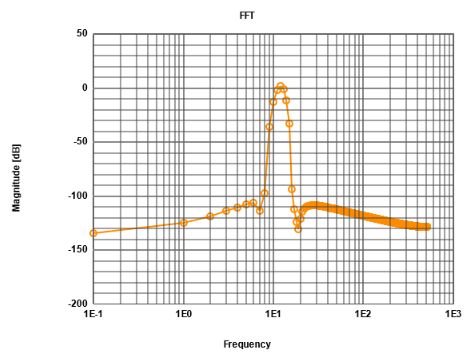
Figure: Windowing an non integer number of periods for FFT
In FFT playground an offset of 0 and amplitude of 5 is used for the experiment.
| Case | Window | FFT points | length | signal / dB | total noise / dB |
Signal width (bins) | adjusted noise |
| Ideal | None | 128 | 64 | 11 | -289 |
1 | -289 |
| Ideal | Blackmann | 128 | 64 | 2 | 4.8 |
6 | -99 |
| Ideal | Hann | 128 | 64 | 4.9 | 5 |
10 | -74 |
| Ideal | Hamming | 128 | 64 | 5.6 | 4.3 |
10 | -74 |
| Ideal | Nutall | 128 | 64 | 2.2 | 4.8 |
4 | -297 |
| Bleeding | None | 128 | 5 | 8.5 | 10 | 1 | 10 |
| Bleeding | Blackmann | 128 | 5 | 1.5 | 5.5 | 7 | -79 |
| Bleeding | Hann | 128 | 5 | 4 | 6.3 | 10 | -42 |
| Bleeding | Hamming | 128 | 5 | 4.5 | 6.3 | 4 | -22 |
| Bleeding | Nutall | 128 | 5 | 1.6 | 5.6 | 7 | -75 |
| Bleeding | None | 128 | 85 | 8.5 | 10.3 | 1 | 10.3 |
| Bleeding | Blackmann | 128 | 85 | 1.8 | 6.4 | 7 | -87 |
| Bleeding | Hann | 128 | 85 | 3.6 | 6.7 | 10 | -62 |
| Bleeding | Hamming | 128 | 85 | 3.8 | 7 | 5 | -40 |
| Bleeding | Nutall | 128 | 85 | 1.9 | 6.4 | 6 | -87 |
| Bleeding | None | 4k | 85 | 8.5 | 10.3 | 1 | 10.3 |
| Bleeding | Blackmann | 4k | 85 | 1.9 | 5.2 | 7 | -83 |
| Bleeding | Hann | 4k | 85 | 4.7 | 5.3 | 10 | -47 |
| Bleeding | Hamming | 4k | 85 | 5.4 | 4.8 | 4 | -27 |
| Bleeding | Nutall | 4k | 85 | 2 | 5.2 | 6 | -79 |
( Kaiser window is not updating in FFT playground)
Windowing: Blackmann and Nutall are good, Hann und Hamming are bad. More FFT points give more noise.
What is limiting the maximum signal to noise ratio for windowing in the simulation? Windowing coefficients?
Now investigate around length 85:
| NFFT | 128 | 256 |
512 | 1024 |
2048 | 4096 |
| length | Signal dB | Noise dB | Signal dB | Noise dB |
Signal dB | Noise dB | Signal dB | Noise dB |
Signal dB | Noise dB | Signal dB | Noise dB |
| 84 | 8.25 | 10.5 | 10.87 | -7.21 |
10.78 | -1.26 | 10.41 | 4.57 |
8.83 | 9.91 | 10.14 | 6.36 |
| 85 | 8.54 | 10.26 | 10.95 | -19.39 |
10.94 | -13.39 | 10.92 | -7.39 |
10.83 | -1.41 | 10.45 | 4.45 |
| 86 | 8.79 | 10.02 | 10.99 | -13.52 |
10.97 | -7.53 | 10.87 | -1.55 |
10.48 | 4.34 | 8.87 | 9.8 |
Since for more FFT points the same period length has higher ratio the signal to noise ratio decreases??
| Frequency: FFT points / 7 | Signal dB | Noise dB
|
| 4096/7 = 585 (585.1428) | 10.97 | -36.18
|
| 2048/7 = 293 (292.5714) | 10.97 | -20.64
|
| 1024/7 = 146 (146.2857) | 10.96 | -18.1
|
| 512/7 = 73 (73.1429) | 10.96 | -18.1 |
More FFT points lead to better signal noise ratio for nearly fitting periods.
Source synchronous signal generation and sampling is required.
Up to EEBench_V05 the XADC sampling rate is 1 MSps and it is done 8 times for the channels
giving fsample = 125kHz (8 us), the signal generator runs at 100 MHz and
gives every 4th clk cycle (25 MHz, 40 ns) a new value.
256 samples are taken for FFT.
There is a factor of 25 between the sources.
There are 2 possible solutions:
1) The XADC sampling rate could be reduced to 25 MHz/32 =781.25 kHz (1.28 us * 8 = 10.24 us).
2) The AWG1 rate is reduced to 4 MHz (counter to 25) update in sineX pipe = "011000" .
Measurement XADC address change frequency at JA1 gives 8.32us/10ns = 832 cycles per sample.
Datasheet (7 Series FPGAs and Zynq-7000, All Programmable SoC, XADC Dual 12-Bit 1 MSPS,
Analog-to-Digital Converter, User Guide, UG480 ) gives 104 clock cycles per conversion
(Figure 5-1: Continous Sampling Mode). This gives 832 cycles per conversion.
Measurement of DA0 JB1 gives 250ns minimum pulse (25 cycles) with variable pipe of 24 in sineX.vhd.
DAC could be 13 cycles per sample: 13 * 64 = 832. Change variable pipe to 12.
Change in NEEBench.html, function genCmdAWG(), curveTyp == 1,
step = Math.trunc(1024*1024*1024/(1E8/4/frequency));
step = Math.trunc(30-bit for sine/(TclkfpgA/(pipe+1)/frequency));
step = Math.trunc(1024*1024*1024/(1E8/13/frequency));
Practical test showed for 3 periods with a step of 196608 = 3 * 64 * 1024 sometimes
a FFT SNR = 1.07 dB - (-96.87) dB = 97.94 is ENOB = SNR/6 dB = 16 Bit.
| Number of cycles | frequency in kHz | Step |
| 3 | 1.40851 | 196608 = 3 * 64 * 1024 |
| 11 | 5.16452 | 720896 = 11 * 64 * 1024 |
| 101 | 47.419625 | 6619136 = 101 * 64 * 1024 |
Again precision 6 is for 101 cycles not enough. Precision of 8 is needed.
How can user friendly frequencies like 10, 20, 50, 100 kHz be used for FFT without bleeding?
| Number of cycles | frequency in kHz | Step |
| 4 | 1.878 | |
| 11 | 5.16452 | |
| 21 | 9.859 | |
| 43 | 20.188 | |
| 107 | 50.237
| |
Summary
- JavaScript and HTML for FFT
- Modification of chart.js
- FFT simulation results of bleeding
- Correct step size for FFT
Open is the implementation for optimum sampling with poer of 2 number of FFT points at
user friendly frequencies while using 100MHz FPGA frequency.
UART needs also fixed FPGA frequency.
Changing frequnecy can lead to clock domain interface.