A CMOS Inverter with parasitic elements and variations
Jörg Vollrath
Dynamic behavior of an Inverter in 50nm technology with parasitic elements is simulated. Variations of transistor parameters, temperature and voltage are studied.
This practical training looks at the electrical behavior of a basic inverter in 50nm technology. It takes into account typical process variations and parasitic elements.
Simulation of an Inverter with parasitic elements
Open Electric and the library Lab_02.jelib.
Select Test_tran_inv{lay}.
Simulate it with SPICE.
Look at the voltages vin, vout1..vout7.
Calculate the transition times using SPICE measurement directives like:
.MEAS TRAN T2_V0790 WHEN V(vout7)=V(VDD)/2 FALL=1Measure (.MEAS) in the transient simulation (TRAN) the time value named T2_V0790, when (WHEN) the voltage vout7 (V(vout7)) equals 0.9V at the first falling transition (FALL=1).
Each measurement value needs a unique label.
A propagation delay can be calculated using for example:
.MEAS TRAN PROP PARAM T2_V0750-T2_V0650For each output voltage include a SPICE command to measure the transition times.
You can see the transition times in LTSPICE using View->SPICE Error Log.
Copy the results to an editor or Excel for later use.
Save your SPICE file as Test_tran_inv_orig.spi.
Otherwise it will be overwritten in the next steps.
We now want to include parasitic in the simulation. In Electric select File - > Preferences - > Tools - > SPICE
Enable Parasitics Conservative RC.
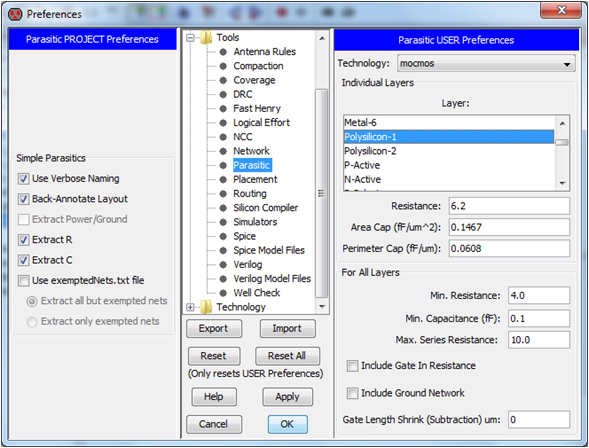
In Electric select File - > Preferences - > Tools - > Parasitics you can see the assumptions for resistance and capacitance.
Redo your SPICE simulation.
Extract your Propagation Delays.
Change the VDD to 1.1V and 0.9V.
Redo your simulation.
Extract your Propagation Delays.
Change the temperature to 90°C and -10C using the statement:
.option TEMP=90Simulate with high Vth transistors and low Vth transistors using the model files:
- cmosedu_models_HH.txt
- cmosedu_models_LL.txt
- cmosedu_models_HL.txt
- cmosedu_models_LH.txt
Extract the data.
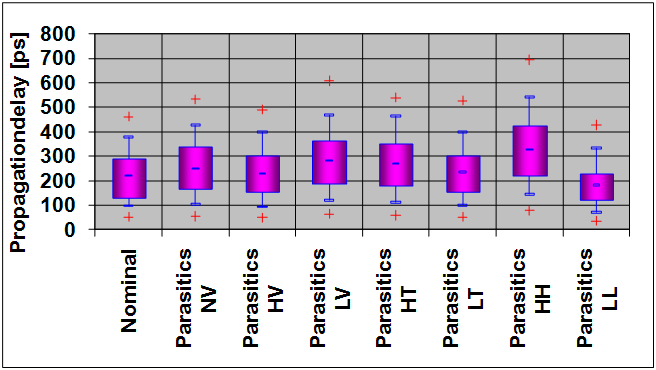
Compare the propagation delays and write a summary of your observations.
You can use the Excel sheet Boxplot.xls to display your results.
For each condition (voltage, temperature, Vt) calculate the mean (Mittelwert) the percentile (Quantil) of all propagation delays of this group.
You should have 8 simulations.
Report
The report should include1) Your experience during the practical training.
What obstacles did you experience how did you solve them? Please work in groups. You should also note down times you spent for each task.
2) Screenshots
Please send your electronic report including your names, group number and lab number to joerg.vollrath@hs-kempten.de. The filename should be < date:yyyy_mm_dd > _Lab05_ < LastName > .pdf.
Please obey the names rule, do not zip or tar the files.
You can use PDFCreator for creating pdf files via the print menue in Windows.