Using models, simulation and measurements for teaching circuit designJörg Vollrath, University of Applied Science Kempten, Germany, Joerg.vollrath@hs-kempten.deAbstractNo cost software tools and low cost measurement equipment enables improved teaching of circuit design. This paper presents results incorporating models, simulation and measurement together in teaching and laboratory. Comparison of circuit equations with measurement and simulation data addresses different learning styles and promotes advance in reflective judgment stages. It is closer to industrial work style and gives the student a feel for variations and accuracy in circuit design and measurement. A low cost electrical laboratory board (Electronic Explorer), a circuit simulator (LTSPICE) and a spreadsheet program can be used during lecture, laboratory and at home to align results and motivate students for a deep learning approach. This paper presents necessary modification for lecture and laboratory and looks at the results using these tools. Keywords: Low cost teaching, learning styles, reflective judgement |
Introduction
Successful teaching of students involves a deep learning approach [1]. Students have to be motivated to study a subject in depth and be able to explore relevant topics. Bridging theory and real circuit design using equations, measurement and simulation can stimulate deep learning. It is important to give students real world experience with real circuit and show relationship between model and measurement. This enables faster learning and understanding of concepts. To my knowledge there is no textbook or lecture available for circuit design teaching, which compares directly theoretic equations, simulations and laboratory measurements side by side. Therefore this paper presents this approach for a semiconductor components and circuits class in a mechatronics bachelor course.
Design of circuits in industry is done having some equations for electronic circuits and adjusting the parameters in the equation to real devices. With the basic equations a transfer function can be calculated. After a simulation confirms the operation, a circuit is built and measured. The difference between measurement, simulation and equation is then evaluated and used to improve the models and circuit performance (Figure 1).
In former time measurement hardware and circuit design software was very expensive and complicated to operate. Data acquisition and visualization was cumbersome. New efforts make a real laboratory available through the internet [4] or use low cost, portable measurement equipment (MyDAQ, Electronic Explorer) affordable for each student [5, 6]. This paper concentrates on low cost, portable measurement equipment to give the student a real experience of an electrical component and circuit. Free simulation software (LTSPICE) complements the learning set up. A spreadsheet program can be used for data evaluation. This setup makes it possible to compare and align theory, model and measurements. Equations can be implemented in the spreadsheet, simulation and measurement data can be imported and graphed. Calculating mean square differences between equation, model and measurement data leads students to critical thinking about precision of theory and models.
To use the full potential of this combination needs adjustment of lectures and laboratory experiments to motivate students to a deep learning approach. Due to the portability and low cost of the equipment the same set up can be used in different locations and contexts: demonstrations during lectures, guided experiments in the laboratory, unguided experiments in open computer laboratories and at home for self motivated studies.
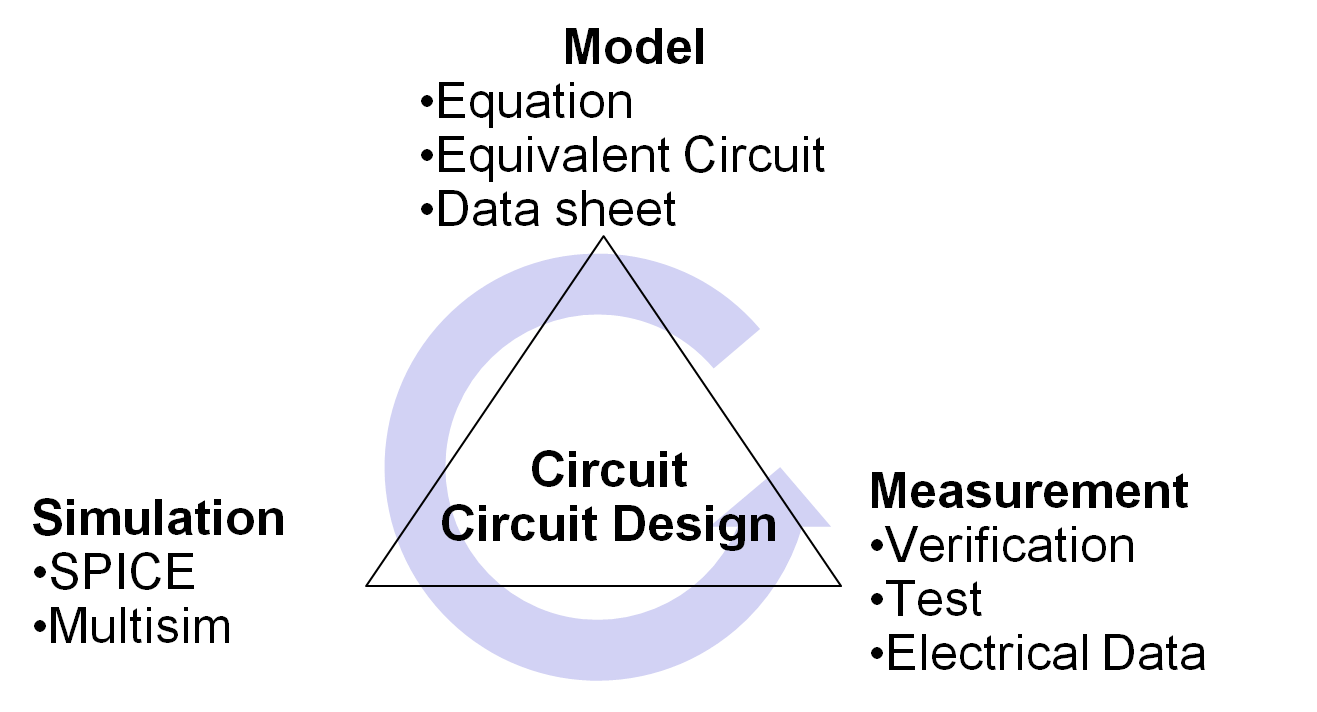
Figure 1: Circuit design process
A sequence of teaching theory, doing real experiments and assessing the difference between theory and measurement and documenting these results can be mapped to an adaption of Kolb's learning model based on Fitzgibbon and Stice [2]: Diverger (Why) Reflective Observation, Assimilator (What) Abstract Thinking, Converger (How) Active documentation, Accomodator (What if), Concrete Experience.
These learning styles can also be mapped to circuit design activities as shown in figure 1. A model is an abstract description of a circuit block. Simulation gives some real experience by building a circuit. Measurement needs to build a working circuit giving a more real experience and documentation and reflection on the data. Comparing data leads to reflective observation and changing the model parameters or the circuit.
Comparing theory in the lecture with measurements and simulations steers students to higher stages of Reflective Judgment according to Kings and Kitchener [2]: Prereflective Thinking (Stage 1,2,3) true and false, Quasi reflective Thinking (Stage 4,5) uncertain, Reflective Thinking (Stage 6,7) evidence.
The following section first presents the tools and concept of lecture, laboratory and home work. Then one laboratory is presented as an example for the chosen approach. A questionnaire is presented evaluating student acceptance. Finally a conclusion and outlook is presented.
II. Tools and Applications
Due to more transistors in integrated circuits it is possible to build very inexpensive, small and portable laboratory measurement equipment, which is easy to operate and can be used by students to gain hands on experience. For measurements an experimental board "Electronic Explorer" is presented first. LTSPICE is widely known, used for simulation and will not be presented here. A spreadsheet application to analyze and compare data is presented. Use cases in lecture and laboratory are shown.
A. Electronic Explorer
"Electronic Explorer" (Figure 2) made by Digilent combines a breadboard with a 4 channel oscilloscope, two arbitrary waveform generators, power supplies, voltage meters and digital IO channels in a size smaller than a netbook at a price similar to a netbook [7]. A small power supply is needed and the board is connected via USB to a PC or laptop running the control software "Waveforms". "Waveforms" is easy to use and for free, which can be used in a simulator mode without the board to get accustomed to the menus and functions. The software is very responsive and has a good user interface.
The breadboard allows building circuits on the board and fixing connections to the power supply and measurement equipment. This small fixed setup can then be easily carried around and is ready to go in minutes. Professors can easily bring circuits on the board to the lecture to demonstrate operation. This is a unique feature compared to other offers like MyDAQ from National Instruments and Visascope [5] and other electronic equipment [3]. It is also possible for students to carry their circuit ideas around for demonstrations or debugging.
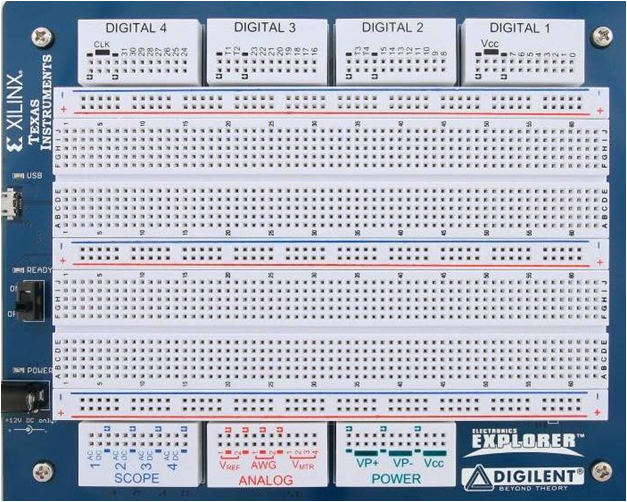
Figure 2: Electronic Explorer board
The board comes with a parts kit providing wires and basic electronic components. Web software was written to be able to draw a circuit diagram before circuit built (Figure 3)
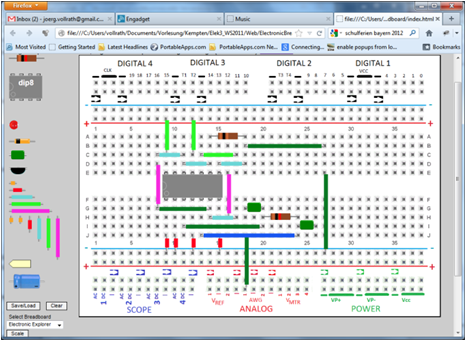
Figure 3: Web application Electronic Breadboard
Documentation is made easy using screen shots and exporting and saving measurement data.
Circuit Simulator and Spreadsheet
It is common practice to use circuit simulators like PSPICE or LTSPICE in classes. The approach in this paper differs from traditional approaches by incorporating the comparison between theory, simulation and measurement in class and during laboratories. Students also learn how to use SPICE to be able to verify results of textbook problems and exercises. Therefore it is much easier to find training problems and verify the correct solution.
For laboratory exercises students use equations to size circuit elements, simulation to confirm calculations and measurement to verify operation. Students have to make a report and a final presentation of their findings at the end of the laboratory. This covers all 4 aspects of Kolb's learning model.
Excel was chosen as a tool to compare different results. It is more common and less expensive than Matlab and allows implementing equations, graphs, optimization and calculating errors (Figure4).
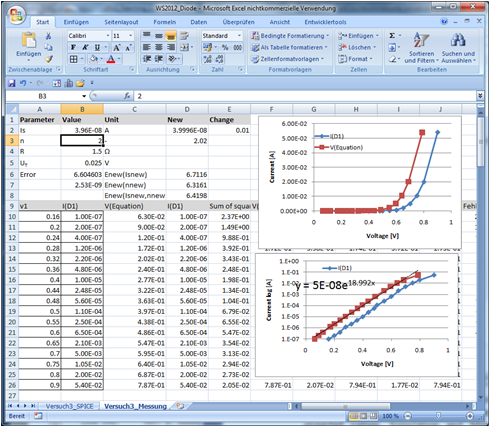
Figure 4: A diode curve comparing measurement and diode equation
Figure 4 shows measurement data for diode voltage V1 and current ID1. D ata is entered in a table and displayed. For these currents the voltage is calculated for a diode with series resistance:
\( V_{Equation} = I_{D1} \cdot R - n \cdot U_{T} \cdot ln\left(\frac{I_{D1}}{I_{S}} \right) \)
By changing the values R, n, UT and Is the theoretical curve can be matched to the measurement curve. Excel calculates the error between the measurements and the equation. A linear and exponential trend line in Excel allows to directly extract R, n, UT and Is from the measurement. Student can study the effect of change of parameters on the displayed curve and is made aware of measurement limitations. This gives the students a feel for the ability and limits how to be able to match theoretic curves with measurements. The limit of matching between theory, simulation and measurement motivates students to reflect about certainties. This stipulates development of higher thinking stages according to Kitchener. Having these tools in Excel allows further study at home. For each laboratory theoretical equations for IV curves were implemented repeating the concept of comparing model, simulation and measurement.
Application
The Electronic Explorer was used frequently during a circuit design class as demonstrator. It was used to demonstrate static IV curves and dynamic behavior of diodes, transistors and operational amplifiers. It is very convenient to have a portable, small setup. It is possible to build the circuits during lecture, having a circuit diagram. A document camera can be used to show the assembly and live operation of the circuits. All measurements can be displayed on the computer screen and a beamer. Student questions can be explored by easy change of operating conditions. This gives confidence in estimating circuit behavior.
A practical laboratory complementing the lecture was designed for an undergraduate Electronics class at the University Kempten, Germany. In the laboratory students worked alone or in groups of two. Single working students were led to discuss problems and results with other students or groups. Each laboratory consisted of 8 identical experimental setups for up to 16 students. Due to the cost of the board, additional experimental setups could be placed in a PC-lab, where students could use the boards at any time to finish the laboratory or to do further experiments.
The topics of the laboratory were:
- Data analysis with Excel
- Diode measurement
- Diode equation in SPICE and Excel
- MOSFET transistor measurement
- MOSFET equations in SPICE and Excel
- Bipolar transistor measurement
- MOSFET as amplifier
- Differential amplifier in SPICE
- Operational amplifier
- Operational amplifier in SPICE
- Reporting laboratory results and experience
Each experiment lasted for 90 minutes. Due to the limited time a learning cycle (theory, model, simulation, measurement) as shown is distributed over a couple of laboratories. Students can review results between laboratories and have smaller learning steps in one laboratory. This sequence was repeated a couple of times. Since previous measurements and simulation were needed for subsequent laboratories the students had to review their previous reports and had to rehearse procedures and results. The laboratory was built 2 times, once with a traditional setup (Figure 5) with an oscilloscope, power supplies, multimeters and signal generator and once using the Electronic Explorer. Written instructions how to conduct the experiment were quite the same using the traditional experimental setup and the new Electronic Explorer. There were different documents about the used breadboards and the operation of the power supply and how to conduct voltage and current measurements.
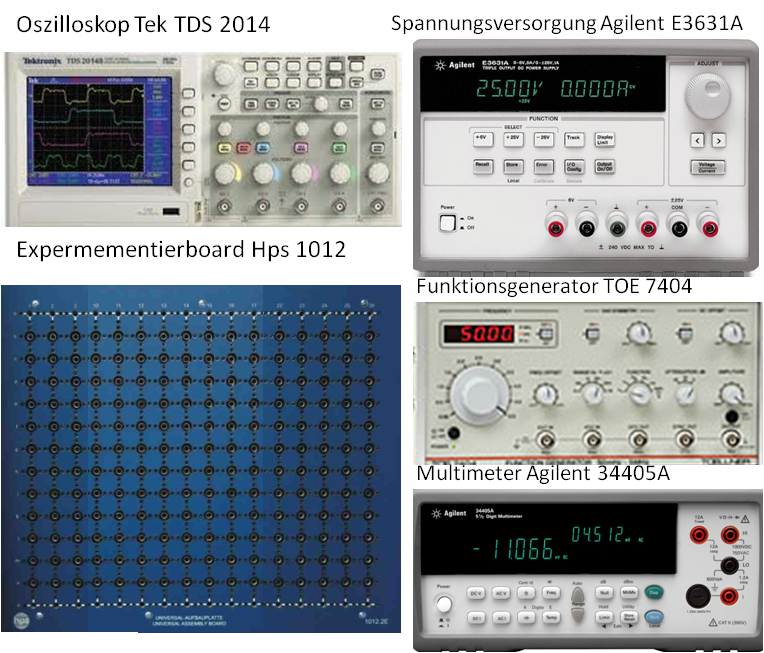
Figure 5: Traditional measurement set up.
For the later experiments the theory and simulation was done in class or at home due to timing constraints for the number of laboratories. The student could repeat the simulation at home or in the computer laboratory on their own before conducting the experiment.
Since there was doubt about having enough measurement accuracy using the low cost Electronic Explorer board quality of results was investigated. After the experiments the resulting 10 model parameters for the components (diode, MOS and bipolar transistor) were collected using a questionnaire.
III. Case Study: Laboratory Amplifier
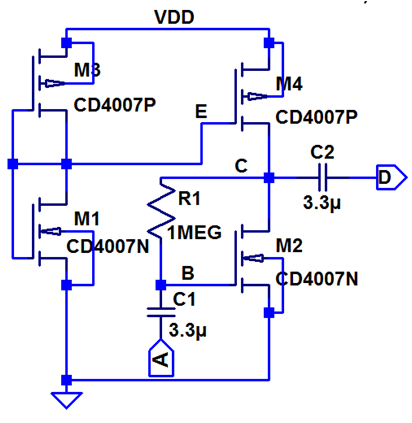
One of the experiments was a design of an amplifier in source configuration with a current source using MOSFETs of the transistor array CD4007. This example is used to show the steps and experiences for the students, which are typical for all laboratory experiments. Figure 6 shows the circuit schematic, the wiring of the breadboard and the theoretical equation for the gain of the amplifier.
MOSFET transistors were measured in a previous laboratory and simple SPICE parameters were extracted. With these values theoretical calculations were done during the lecture to prepare the students for the laboratory and address assimilator type students. Operating point voltages and currents were calculated. Using small signal circuit input resistance, output resistance and gain was calculated. The laboratory included verification of these results using LTSPICE and measurement. The same basic equations are used in LTSPICE with a LEVEL=1 MOSFET model. LTSPICE can exactly confirm the calculated results. Therefore the student gets confidence in using LTSPICE to verify solutions of textbook problems. It is also possible to use more advanced transistor models to improve matching between simulation and measurement. After the measurements results are compared to simulation. Investigation can show the influence of component variability and limited device models on result matching. Experiencing differences between theory, simulation and measurement students are steered to critical thinking.
(a)
(b)
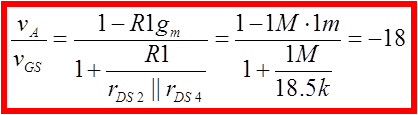
(c)
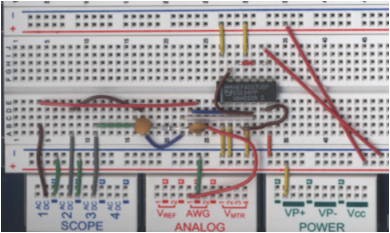
Figure 6: MOSFET amplifier laboratory a) schematic, b) calculation, c) breadboard
Typical results comparing one static voltage and gain of the amplifier are shown in table 1.
Table 1: Comparing results for a source amplifier
| Electrical Parameter | Table Column Head | ||
| Calculation | Measurement | SPICE | |
| VE (V) | 2.39 | 2.44 | 2.43 |
| AV | -18 | -22 | -20.4 |
The matching is good and leads to discussions and further experiments about matching.
IV. Student Evaluation and Feedback
Evaluation of the experimental setup was done with one class of 46 students. There were 8 laboratory setups each operated by two students as a team. There were 8 traditional setups with power supplies and oscilloscopes available and 8 new setups with "Electronic Explorer" boards. Two laboratories measuring a diode and a MOSFET were conducted using the different setups as shown in table 2.
Table II: Experimental Setup
| Laboratory | Groups | ||
| 8 groups of 2 students | 8 groups of 2 students | 8 groups of 2 students | |
| Diode | Traditional setup | Traditional setup | Electronic Explorer |
| MOSFET | Electronic Explorer | Electronic Explorer | Traditional setup |
The students were randomly assigned to the groups.
A questionnaire was used to evaluate differences between the traditional setup and the Electronic Explorer:
| 1. Laboratory exercise was | Difficult 5, 4, 3, 2, 1 Easy |
| 2. Building the circuit was | Difficult 5, 4, 3, 2, 1 Easy |
| 3. Operation of measurement equipment was | Difficult 5, 4, 3, 2, 1 Easy |
| 4. How much time did you need for measurements? | A lot 5, 4, 3, 2, 1 little |
| 5. How do you rate the amount of work given the laboratory time? | A lot 5, 4, 3, 2, 1 little |
| 6. Did you have any problems during the laboratory? If, yes please describe the problems. | |
| 7. What did you learn during the laboratory exercise? |
The results are shown in Figure 7. Given the number of groups and students it can be seen that there is no difference in using the traditional setup compared to the cheaper and less accurate Electronic Explorer. Unfortunately there was also no significant improvement in the conduct of the laboratory seen.
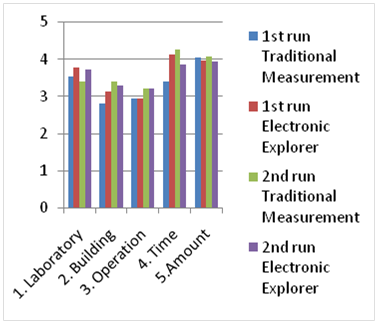
Figure 7: Evaluation of the laboratory
12 of 31 comments (38%) showed a critical thinking about matching of measurement results to theory.
Also the measurement results and extracted parameters were evaluated. All extracted values were compared to the expected values. Groups using the Electronic Explorer board showed 80.25% good extracted parameters versus 77.61% of good values using the traditional measurement setup (Figure 8).
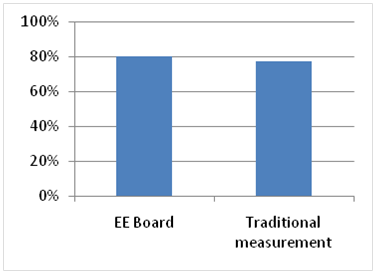
Figure 8: Good extracted electrical model parameters.
Besides the laboratory also student problem solving lessons were conducted. It was noted that some of the students used LTSPICE on their own to verify their solution. Less guidance from a professor was needed.
Conclusion and outlook
In this work it is possible to address different learning styles and steer students to critical thinking using an approach comparing theory, model, simulation and measurement using low cost equipment.
It is very difficult to assess the impact of new laboratory equipment for students learning outcomes. Different equipment requires slightly different laboratory instructions impacting design of experiments. At least this investigation showed no negative impact on accuracy of measurement results and laboratory experience. With the current group of students there was no significant difference between traditional laboratory equipment compared to the Electronic Explorer. Since the class is still ongoing final report results and examination results will be evaluated. This investigation will be repeated with a larger group of students, better instruction and a more detailed questionnaire.
Using Electronic Explorer has some benefits. Inexpensive equipment can be used instead of costly solutions making it possible to provide more laboratory set ups to students. Availability to students can be increased. Self organized learning of students can be promoted. Collecting data electronically makes documentation and result checking easier.
Evaluation and improvement of self paced learning with the Electronic Explorer needs more investigations. Electronic Explorer boards are now distributed in an open PC-laboratory, so that students have access all the time.
References
[1] Teaching for Quality Learning, John Biggs, Catherine Tang, Open University Press, McGraw Hill, 2011, pp. 22-25
[2] Frontmatter, in Engineering Education: Research and Development in Curriculum and Instruction, J. Heywood, John Wiley & Sons, Inc., Hoboken, NJ, USA, 2006, pp.130-131
[3] Pocket Oscilloscope Review Roundup, Michael Jay Geier, IEEE Spectrum, March 2012, http://spectrum.ieee.org/geek-life/hands-on/pocket-oscilloscope-review-roundup
[4] A Web-Based Remote Access Laboratory using SCADA, Z. Aydogmus, O. Aydogmus, IEEETransactions on Education, Vol. 52., February 2009, pp.126-132
[5] Eine universelle Laborplatine für den praktischen Elektronikunterricht, Rudolf Koplitz, MPC-Workshop Offenburg, Januar 2003, p.13-26 http://www.mpc.belwue.de/pub/Public/WorkshopBand29/MPC_Workshopband_29.pdf
[6] MyDAQ, National Instruments, www.ni.com
[7] Electronic Explorer, www.Digilentinc.com
[8] Matlab, www.mathworks.de M. Young, The Technical Writer's Handbook. Mill Valley, CA: University Science, 1989.