Interactive Tools for Teaching Electrical EngineeringJörg Vollrath, University of Applied Science Kempten, Germany, Joerg.vollrath@hs-kempten.deAbstractOutcomes based teaching and learning requires monitoring of teaching and students learning. So far teaching can be monitored by video, document camera or screen recordings or by a coach. This creates hard to edit video content. Also static questionnaires are used for outcome monitoring and problem solving purposes. This paper presents a new approach using dynamic HTML5 web pages with JavaScript enabling creating editable and searchable open source content on the fly in real time during lecture. Data can easily be transferred from the web page to data processing tools. This allows explorations by students. Based on this automated problem generation and solving is shown in an example of root mean square voltage calculation. Results can be sent to a server to implement a live feedback system. All data and programs are embedded in the web document. Therefore it is much easier to reuse content, evaluate style and improve lectures increasing efficiency of teaching. Keywords: Web based teaching, live feed back system, e-learning |
Introduction
Classic teaching is based on a book, writing on a black board and having problems for students. A book guarantees fixed content and can be reused. Teaching is a unique live event. Students listen to the teacher, rehearse topics at home and solve given problems. Students can be more active during laboratory experiments often used in engineering. According to [1] this has changed and many more methods are used for teaching and learning. A challenge in teaching is to use up to date material and improve teaching to optimize the outcome of students learning. Preparation for a lecture takes a lot of time. Experience has shown that lecture preparation needs at least double teaching time. Planning learning centered student activities or experiments needs even more preparation time. This work looks at current resources of teaching material and deals with improved tools to create content and activities for electrical engineering classes. Live feed back is used to optimize teaching and learning.
Table 1 shows a list of selected resources for teaching electrical engineering and the available material. Agrawal [2] and Baker [3] have written books accompanied by a website and videos. YouTube, Wikipedia and Wikiversity are websites only. Modern teaching uses not only textbooks, slides, problems, demonstrations and laboratories, but also multiple choice questions with live feedback. Time estimates are important to plan lecture preparation and duration. Time estimates should also assess the workload for the students. Baker has included examples using a circuit simulator LTSPICE. It is important to include electronic tools like LTSPICE, since electronic tools are heavily used in electrical engineering industry. Agrawal offers also a MOOC, which is not mentioned in the table. This work deals only with lecture creation and maintaining. In [7] an example for a low cost high effective electronics laboratory is given.
There are also other useful resources to create a course. Lecture content can be transferred as hand written or printed notes from colleagues. Books can be used as reference for students and teaching is facilitated, if slides or pictures are available for the professor. Nowadays it is easy to read a lot of book reviews online and get the table of content to be able to select the best book for a given class. Wikipedia and Wikiversity are of limited use. In Wikipedia texts to a given topic are too long and getting longer and no exercises are present. Wikiversity is incomplete. YouTube videos are readily available, but it is hard to find the best one for a given topic, extra slides are most of the time not available and it takes a lot of time to review a video. So the best source for lecture content is university web sites with open courseware.
Table 1: Resources for electrical engineering
| Agrawal [2] | Baker [3] | You Tube | Wikipedia | Wikiversity | |
| Book | x | x | |||
| Video | x | x | x | ||
| Website | x | x | x | x | |
| Extended text | x | x | x | x | |
| Slides | x | x | |||
| Problems | x | x | x | x | |
| Laboratory | x | x | x | ||
| Multiple Choice Questions | |||||
| Time Estimate | x | x | x | ||
| Step by step solutions | x | x | x | x | |
| Syllabus | x | x | |||
| Demonstrations | x | x | x | ||
| Assignments | x | x | |||
| Exams | x | x | |||
| Tools | x | x |
State of the art is recorded video lectures of a whole class accompanied by written transcript, PowerPoint slides, exercises, tools and questionnaires. Unfortunately there is a lot of effort involved to create a complete set of lectures and only few sources exist, where all the content is publicly available as shown in the table. Examples are [2] and [3]. Also own experience was gained using live desktop video recording for problem solving and laboratories.
PowerPoint was used to calculate a transfer function of a RLC circuit and to draw the Bode diagram. It was possible during an exercise to do a live screen and audio recording of the solution of the mathematic equations to generate the transfer function. The Bode diagram was drawn using the built in line functions and graphing tools of PowerPoint. The recording was stressful, but could be done with no extra effort outside the lecture. During the recording a miscalculation was made. It proved to be difficult to edit the video and it is very annoying to record a better version.
A live video was also used for a laboratory instruction. In this video a laboratory exercise was done in real time. The students watched the video during the laboratory. They build an experimental set up according to the video and wrote some code to do the experiment. The video covered most of the obstacles of the experiment, so the students did not need any extra assistance during the laboratory. Students needed 2 to 3 times more time to do the laboratory compared to the video. Also this video had some flaws and showed how difficult it is to do a good recording.
Due to these experiences problems were identified and a vision for creating educational resources was developed. Static slides in PowerPoint or pdf format are difficult to copy, mix and modify to keep learning material up to date. Animated web pages using JavaScript can be used to create animations and make it possible to easily change, mix and search content. All content is easily accessible as html or JavaScript text file. Only a web browser is needed for creating and displaying content. Only short videos showing program operation or live experiments are embedded in the web pages. A web based presentation system should be used including extended text. For electrical engineering also equations, scatter plots and schematics are needed. To make the system open and content reusable, equations should be easily copied to other programs and schematics should be transferable to a circuit simulator like LTSPICE. To assess lecture pace a time logging function should be present. A live feedback system can be also implemented in the web page using a web server. This makes it possible to monitor student progress and makes it for students easier to pose questions anonymously.
This work presents the status of tool implementation to enable easy creation and recording of complete lectures, exercises and questionnaires locally on a PC and make it possible to send data to a server. Since the tools are web based and implemented in HTML5 and JavaScript all content is searchable, available and reusable and can be easily modified.
II. CREATING A LECTURE
It is easy to create web pages with text and pictures for presentations on the fly during a lecture. A text editor or a HTML5 based editor can be used for entering content. There are plenty of tools available for creating web based presentations. It is a challenge to create a second window to be able to display the chart for the audience and keep it synchronized to the editor. This work uses the program S5 [8], due to its simplicity, to display presentations as a base. There is a slide view and text view available and content is automatically scaled to screen resolution. Simple markups define annotations, animations, slides and general layout using a css style sheet. This program was adapted to scaling pictures, graphs and schematics when the window is resized.
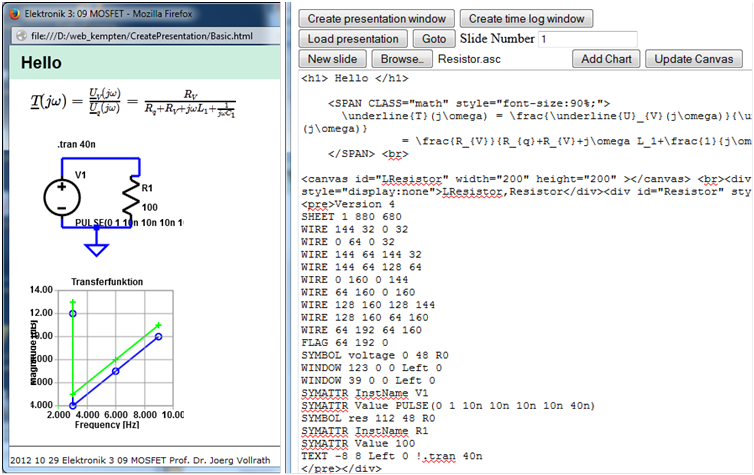
Figure 1: A presentation editor and display window
Since the program is web based, it was easy to extend the program for time keeping and other features. A special editor was realized in JavaScript. It can load a S5 presentation, edit content or create new content. Since slides with graphs, pictures and schematics are pretty complex it was decided to synchronize a parent and child window with special messages. Each slide is divided in blocks and only edited blocks are updated. A typical session is shown in figure 1. On the left is the presentation window with an equation, a schematic and a chart, on the right is the edit window with source code and buttons to launch the presentation window, load schematics and charts. Challenges in electrical engineering teaching are displaying equations, making graphs and charts and showing circuit diagrams on a web page providing also the source data for reuse.
Equations can be created and displayed using JSMath [9] or MathJax [10]. LATEX notation is used to define equations and LATEX source code is made available on the web page using a mouse click. This makes it very easy to import and export equations. It is also possible to evaluate or generate equations using JavaScript.
For line graphs a tool was programmed, which generates graphs in HTML5 canvas from equations or tables. All original data are easily accessible in the web page source code and reusable. The graph tool is only one JavaScript file of 18KB size. It has 14 functions and is easy to manipulate and to add specialized features. Source code can be found at [11]. JavaScript code can be used to generate data tables of the graph or to reuse the function in another context for calculations. Figure 2 shows a typical example of a bode plot. Since the equation is embedded in JavaScript it is also possible to animate the graph. It enables the students and the professor to change parameters on the fly and look at the effects on the graph. This can be used to measure and improve understanding of equations.
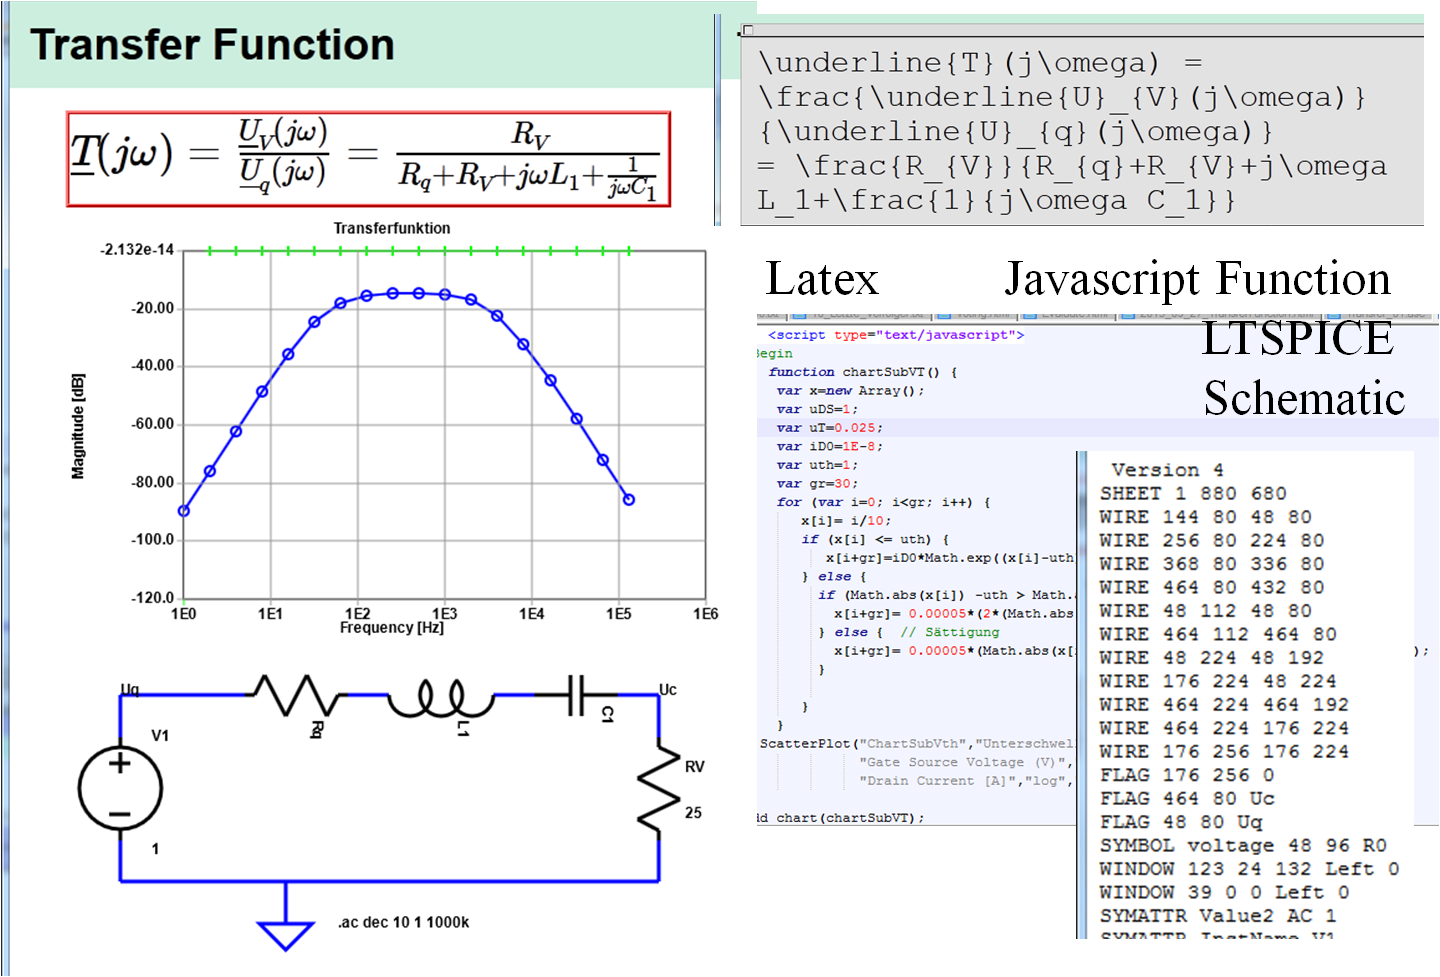
Figure 2: A web page with equation, graph and schematic providing also reusable code [4]
In an electronics class this was used to display the electron mobility dependence on doping level.
\( \mu_n = 92 + \frac{1270}{1 + \left( \frac{N_T}{1.3 \cdot 10^{17}} \right)^{0.91} }\)
This makes it possible to calculate a mobility directly using JavaScript code and it is not necessary to estimate a value from the graph.
Another JavaScript module displays schematics in a web page and makes the code transferable into LTSPICE (Figure 2). Using HTML5 canvas element it is easy to draw a schematic from the ASCII files provided by LTSPICE. Since it is not possible to access local files LTSPICE schematic code has to be included in the webpage. In a client server configuration the ASCII file can be retrieved with a GET command from the server. Another challenge is the use of sub circuits, which are saved as separate files in LTSPICE. Again all sub circuits have to be included in the web page. Simple R, L, C elements are also realized as sub circuits and are included as string variables in JavaScript to keep HTML files small and speed up data processing. So far simulation results can be included as pictures on the web page. For the future it is planned to access LTSPICE output files directly and display results. Realizing this basic functionality took two man weeks.
All circuit information is present in the page. It is directly displayed by clicking on the circuit and can be copied to the local PC to start a circuit simulation. Unfortunately the schematic can only be created in LTSPICE and must be copied into the HTML web page.
During presentation audio can be recorded with Audacity and JavaScript records all times were a page turn occurs. This makes it possible to generate an animated web page presenting lecture content including audio.
III. AUTOMATED PROBLEM GENERATION AND SOLVING
JavaScript allows randomizing a given class of problems. An example is root mean square calculation of a displayed periodic waveform for a basic electronics class (Figure 3).
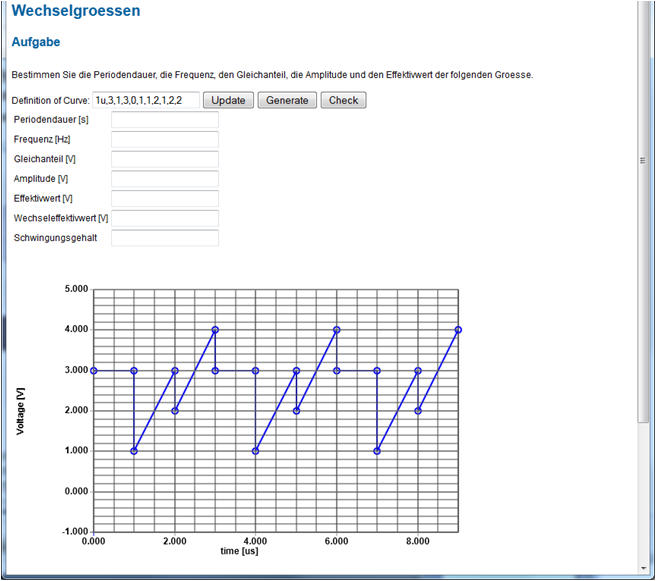
Figure 3: Automated problem generation for root mean square calculation [4]
An algorithm generates waveforms on the fly using random parameters for a piecewise linear waveform definition. The waveform is displayed using the JavaScript graph tool. The page uses an algorithm to show a step by step solution using JavaScript. The piecewise function equation is displayed with JSMath. JavaScript allows to create equations on the fly and also to provide algorithms to do a step by step solution. For each step a comment states the operation and equations are generated on the fly and displayed using JSMath (Figure 4). The student has to click for each individual step. This gives the student the opportunity to watch only critical steps and solve the rest of the problem on his own. Variations of a class of problems using random functions give unlimited training for students. Solutions can be checked with the solver and also the professor can get feedback using live feedback data on a server. Students are only allowed to submit an answer to the live feedback server, if the solution was not activated. Using the graphing tool it was possible to realize this functionality in one man week. At the moment it is possible to generate new waveforms by changing the input field for the Definition of the curve or to add it to the internal JavaScript definition array. Waveforms could also be generated with using random values. This is planned for the future.
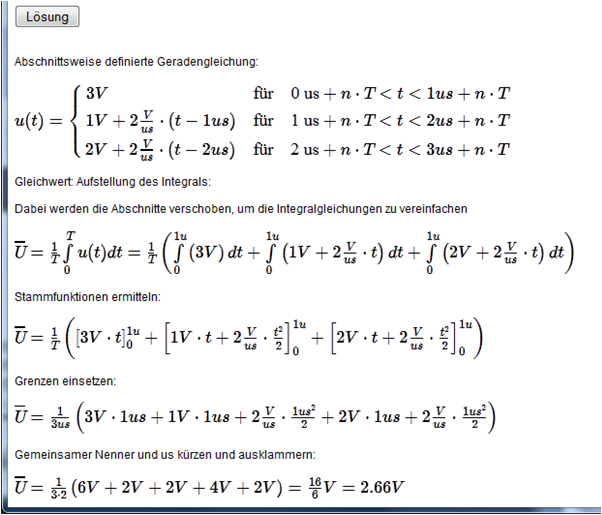
Figure 4: Displaying step by step solution
It is planned to extend this method using automatically generated LTSPICE circuits to pose problems calculating voltages and currents for RLC circuits.
All web page JavaScript examples can run on a local computer and do not need any server. Since the browsers are highly optimized for performance all applications run smoothly on a laptop or PC. Experiments showed no problems feeding a couple of Mbytes of data into the graphing application.
IV. A LIVE FEEDBACK SYSTEM
There are many classroom response (CRS) or live feedback systems available using proprieatory hardware. Some systems also use a less costly web based approach. The student uses his own device to access a web page to be able to access questions and give his response. If students don't have own devices it is also possible to use a computer laboratory to do the questionaires. Due to cost reasons it was decided for the live feedback system to use a basic web server with php or perl [11]. There are WLAN access points available at University to access internet. Beside the public web space stand alone WLAN access points or portable WLAN harddrives can be used to run the web application from a memory card or a hard drive. Therefore the application and live feedback service is portable. This work used a satellite GoFlex hard disk with a modified firmware to provide a live feedback system. The live feedback system is realized using web pages, which can use all tools mentioned before to display content. It is difficult to find examples how to realize a live feedback system. Normally the server side scripts are residing on a server and are not directly accessible. It took a lot of trial and error to realize the correct perl and php scripts. It was decided to include these scripts and documentation in the basic web page as hidden text. So it makes it easy to copy, transfer and modify the live feedback system. In the future it is planned for the script to be able to send back the script contents to the webpage to keep the documentation up to date and live. The perl and php script take the input from a XMLHttpRequest, appends it to a comma limited file and then sends back the complete file to the client. The client can then process and display the results. Only one php or pl file is needed to provide the full functionality keeping it simple. Program development is more tedious since it requires a server and a client for programming and debugging. It is also difficult to keep the php and perl solution in sync and test all possible use cases.
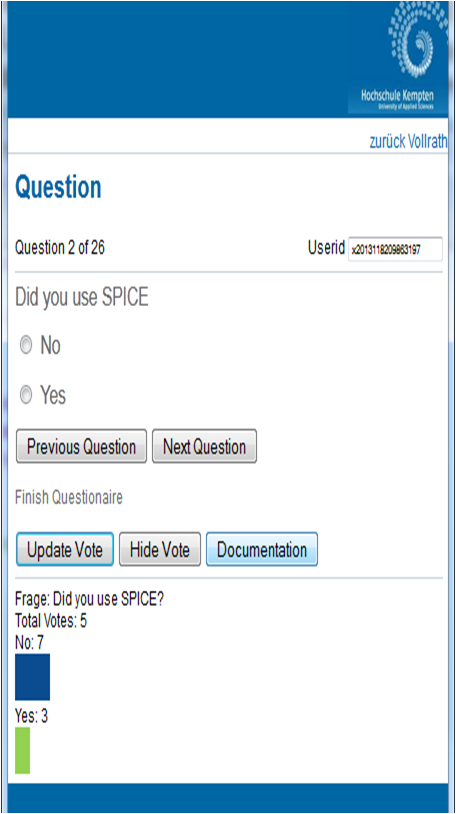
Figure 5: Live feedback system showing question and statistics
Multiple choice questions are stored in an array in the web page file and can be modified with a text editor. Free form input and including of additional html files is also possible. It is planned to be able to retrieve special hidden <div> sections for questions to include everything in one file.
During the questionaire the number of questions are displayed. For live feedback statistics are visible for the teacher. A UserID is automatically generated and stored in a cookie, but can also be set by a user. Therefore the answers are normally anonymous, but the user can choose to personalize answers. Each answer is recorded with a time step, user id, question and a duration in a text file. This makes it possible to limit the evaluation to a certain time frame or certain user IDs. Only the teacher can access the text file. This file can be accessed via the web page, but also transfered to Excel for postprocessing. No database was used to make installation and result evaluation easy. It took 2 man weeks to implement this system. Figure 5 shows the live feedback system with a typical question and statistical results.
During an electronics class laboratory the live feedback system was utilized using PCs to assess the knowledge of the students. 16 groups with 2 students each answered 10 questions. One question assessed only previous familiarity with LTSPICE there was no right or wrong answer. Each question could be answered multiple times, if the students wanted to improve their answers. Time was logged between the display of the question and the submission of the answer. It took between 3 and 12 minutes with a mean value of 7 minutes to answer all 10 questions. The students answered 5 to 9 (all) questions correctly with a mean of 6. 81% of all questions (16*10=160) were answered once, 11% of the questions needed 2 tries, one question had 7 tries with one group. This gave an indication of the difficulty of the question and led to rehearsal of concepts. There was no correlation between duration and quality of answers. It was also tried to determine the reading competency of the students with a long one page text with new material. It took students between 1 and 7.5 minutes with an average of 2 minutes to read the text. No correlation was found between reading speed and correct answers.
V. RESULTS
The presented tools create awareness of time. Creating content during the lecture slows down the pace and the students give positive feedback. Recordings also allows assessment of the quality of a lecture and improvements can be made. It was also noted that long presentations with complex content have some performance problems. The content is not presented fluently.
Repeated time measurement during problem solving gives the student feedback of his progress to solve problems quicker over time. It gives the professor feedback about the capabilities of the students.
The tools create live data. Everything is easily reusable. Since a graph of the IV curve of a transistor is generated with a transistor equation in JavaScript, this code can be reused. The code can be modified to display curves with changed parameters, to animate the curve or fit meaurement data. Equations can also be exported to Matlab to start simulating. This creates a real integrated solution, where the same data can be used for data analysis, documents and presentations using style sheets and JavaScript to show and hide content and to change formatting. This is much easier than managing this data with separate programs like Excel, PowerPoint and Word.
New technologies like HTML5 and the canvas element make it much easier to develop custom made systems from scratch. The internet gives direct access to code to be able to learn how to realize even complex systems in a limited time frame. All tools were developed by one person during one year beside the regular work.
VI. SUMMARY AND OUTLOOK
The developed tools can be used to easily create reusable teaching content and automated problems. All tools are public available at no cost and can be easily modified. Having more teaching content publicly available makes it possible to advance learning and to improve teaching. It is planned to create more multiple choice questionnaires. These can be used during the lecture with a portable WLAN access point and students mobile devices or during the laboratory at PCs where 2 students answer a questionnaire together. It will be interesting to compare results of more students and to test the limits of the current system. So far only classes up to 60 students at the same time have been tested. Time measurements for questionnaires and content creation and presentation can be used to study effectiveness of teaching and learning. How much time is needed to present and master a specific topic? More experience has to be gained using these tools in electrical engineering classes.
REFERENCES
[1] J. Heywood, Frontmatter, in Engineering Education, Wiley, 2006
[2] Anant Agrawal, MIT Opencourseware, Circuits and Electronics, 2007
[3] R. Jacob Baker, CMOS Circuit Design, Layout, and Simulation, 2010
[4] www.youtube.com
[5] www.wikipedia.org
[6] www.wikiversity.org
[7] Jörg Vollrath, Using Models, Simulation and Measurements for Teaching Circuit Design, EDUCON, Berlin, 2013
[8] Meyer, A simple standards-based slide show system, meyerweb.com/eric/tools/s5/
[9] JSMath, http://www.math.union.edu/~dpvc/jsmath/
[10] MathJax, http://www.mathjax.org/
[11] Jörg Vollrath, Electronics , UAS Kempten, Electrical Engineering, 2013, https://www.hs-kempten.de/personen/joerg-vollrath