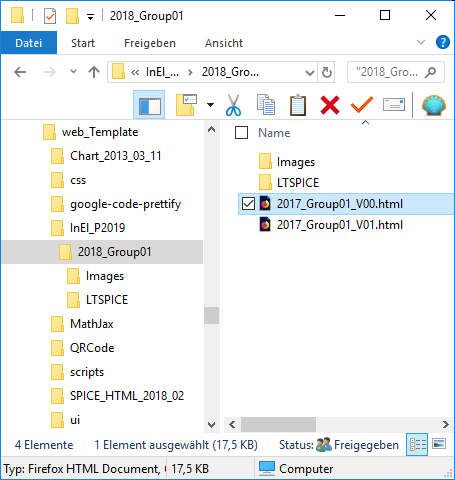
File structure
|
General directory web_Template. Web page html file is in subdirectory "2017_Group01". The other directories contain general used modules.
Open Access: No cost. |
|
Download the ziped directory web_Template.zip .
Unzip the file.
There is a general directory web_Template.
The web page html file is located in a subdirectory "2017_Group01".
Different projects or groups can have separate directories.
The other directories contain general used modules.
The web page will be displayed offline, with different internet browser on different devices.
Since all pages can be downloaded it enables the user to add and modify content.
A locally installed web server can enable file writing and saving of user data.
With this installation you can also copy the Internet files from Interface Electronics to your local drive in a separate directory and use and modify them offline.
The goal is to enable faster and broader advancement of learning material, to ease learning and give open no cost access.
Unzip the file.
There is a general directory web_Template.
The web page html file is located in a subdirectory "2017_Group01".
Different projects or groups can have separate directories.
The other directories contain general used modules.
- Chart_2013_09_11: A chart drawing JavaScript module.
- css: The formatting for the web page: color scheme and general appearance
- google-code-prettify: Code highlighting and line numbering for many programming languages
- MathJax: Displaying equations on a web page using a LATEX style notation.
- QRCode: Generates QR codes from text and display the link for the current file
- scripts: JavaScript files
- SPICE_HTML_2018_02: Displays LTSPICE files directly in the web page and enables the user to redo simulations.
- ui: JavaScript presentation module
The web page will be displayed offline, with different internet browser on different devices.
Since all pages can be downloaded it enables the user to add and modify content.
A locally installed web server can enable file writing and saving of user data.
With this installation you can also copy the Internet files from Interface Electronics to your local drive in a separate directory and use and modify them offline.
The goal is to enable faster and broader advancement of learning material, to ease learning and give open no cost access.
Operation
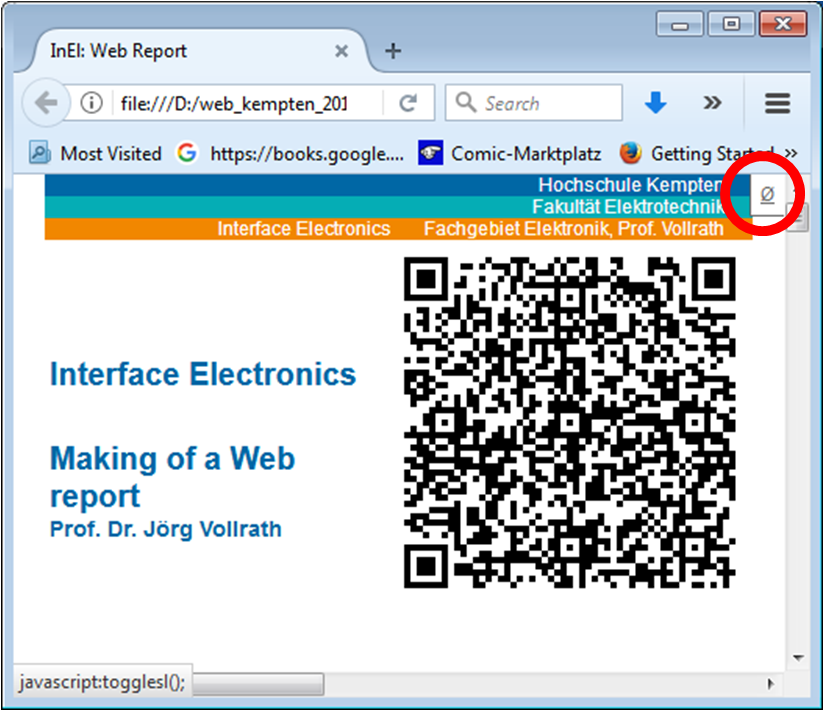
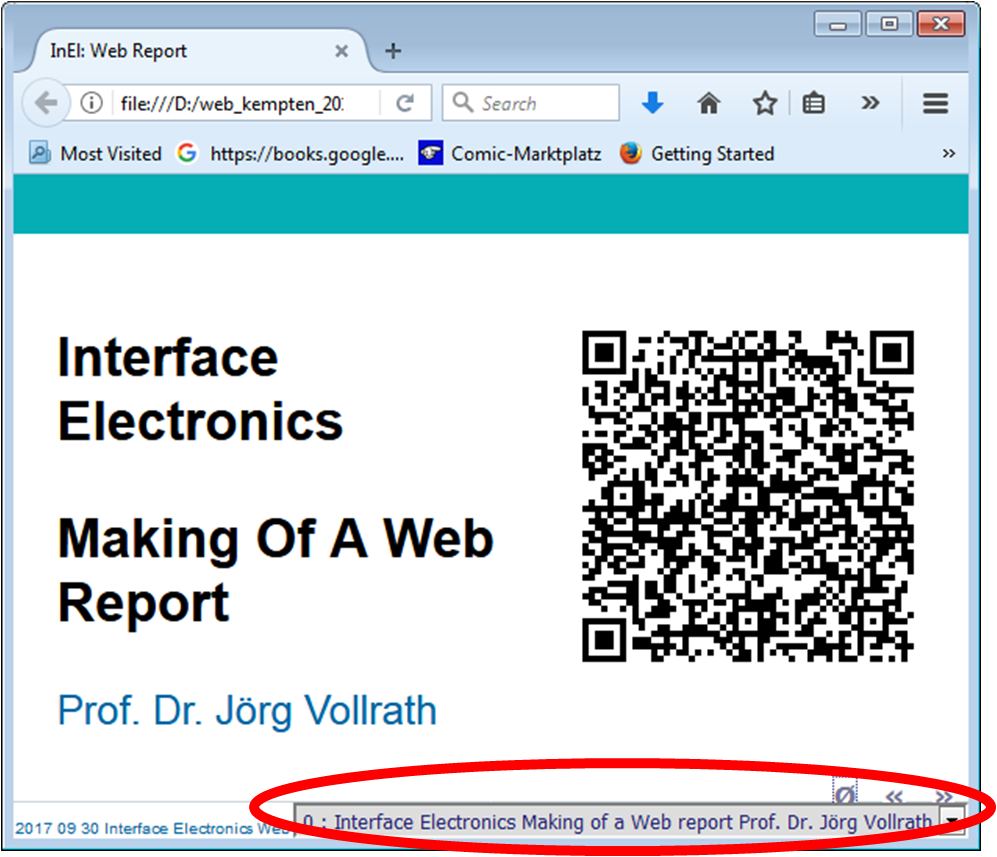
Presentation modeThere is a button to switch between presentation and handout mode.Top right corner. Graphics and text are scaled accordingly. Hovering with the mouse in the lower right you can select the next slide or bring you back to outline mode |
|
Editors
|
Text Editor likeNotepad++ Syntax highlighting Special control sequences needed. (HTML, JavaScript) Very compact code. HTML Authoring: Microsoft Expression Web WYSIWYG Editor What you see is what you get Creates a lot of overhead formatting No JavaScript live view. |
|
Presentation module
|
A module S5 is used for switching between presentation mode and handout. This scales all text and graphics accordingly and adds controls. Each slide starts with a 'div' with 'class' "slide".
Each slide can have additional text with a 'div' with 'class' "handout".
|
|
The presentation module needs following code:
During modification check the result in a web browser frequently to catch errors early.
<!-- metadata -->
<meta name="generator" content="S5" />
<meta name="version" content="S5 1.1" />
<meta name="presdate" content="20121001" />
<meta name="author" content="Joerg Vollrath" />
<meta name="company" content="Kempten University of Applied Science" />
<!-- configuration parameters -->
<meta name="defaultView" content="outline" />
<meta name="controlVis" content="hidden" />
<!-- style sheet links -->
<link rel="stylesheet" type="text/css" href="../css/style.css" media="all" />
<link rel="stylesheet" href="../ui/default/slides.css" type="text/css" media="projection" id="slideProj" />
<link rel="stylesheet" href="../ui/default/outline.css" type="text/css" media="screen" id="outlineStyle" />
<link rel="stylesheet" href="../ui/default/print.css" type="text/css" media="print" id="slidePrint" />
<link rel="stylesheet" href="../ui/default/opera.css" type="text/css" media="projection" id="operaFix" />
<!-- embedded styles -->
<style type="text/css" media="all">
.imgcon {width: 525px; margin: 0 auto; padding: 0; text-align: center;}
#anim {width: 270px; height: 320px; position: relative; margin-top: 0.5em;}
#anim img {position: absolute; top: 42px; left: 24px;}
img#me01 {top: 0; left: 0;}
img#me02 {left: 23px;}
img#me04 {top: 44px;}
img#me05 {top: 43px;left: 36px;}
</style>
<!-- S5 JS -->
<script src="../ui/default/slides.js" type="text/javascript"></script>
There is also code needed for displaying the slide:
<div class="layout">
<div id="controls"><!-- DO NOT EDIT --></div>
<div id="currentSlide"><!-- DO NOT EDIT --></div>
<div id="header"></div>
<div id="footer">
<hr>
<h1>2017 01 11 Interface Electronics 10 Pipeline Prof. Dr. Joerg Vollrath  </h1>
</div>
</div>
The best stratgey is to reuse example code, copy it and modify it.During modification check the result in a web browser frequently to catch errors early.
Inline image and QR code
The document includes the QR code JavaScript.<!-- QR Code --> <script src="../QRCode/jsqr-1.0.2.js" type="text/javascript"></script> <canvas id="thisQR"></canvas>At the end of this document the QR code of this webpage is displayed in the canvas.
An inline Image can be inserted with following code.
<img src="data:image/png;base64,iVBOR" alt="" width="300" />The string can be generated with:
https://www.base64-image.de/
var blobUrl = URL.createObjectURL(data.blob);
Example:
Loading external files
An example is given with LTSPICE in the LTSPICE Javascript code using JQuery.
	   try {
            $('#idDivExternalFile').load('filename.ext');
	   }
       catch(err){}
The file 'filename.ext' is loaded into the block with id 'idDivExternalFile'.Parsing the external file has to be done after load.
A function is looking at the length of the content and is then evaluating the content.
function startEval() {
    var notloaded = false;
    if ( document.getElementById("idDivExternalFile").innerHTML.length < 60)  {
        notloaded = true;
    }
    if ( notloaded ) {
        setTimeout(startEval,500);
    } else {
        evaluate("idDivExternalFile");
    }
}
SVG drawings
External svg is working
svg section only gives error in slide.js
TypeError: object.className.search is not a function
Overlap

Top Left
|
Canvas Top Left
|
A container class has to have a css element position relative to document content.
Then an absolute position for the text can be chosen.
<style>
img.ov {
    position: absolute;
    left: 0px;
    top: 0px;
    z-index: -1;
}
.container {
    position: relative;
}

.topleft {
    position: absolute;
    top: 8px;
    left: 16px;
    font-size: 18px;
}
</style>
<table><tr><td>
<div class="container">
  <img src="Images/w3css.gif" alt="Norway" width="100" height="140">
  <div class="topleft">Top Left</div>
</div>
</td><td>
<div class="container">
  <canvas id="test" width="100" height="100"></canvas>
  <div class="topleft">Canvas Top Left</div>
</div>
</td></tr></table>