Copy the following code into a new sketch.
/*
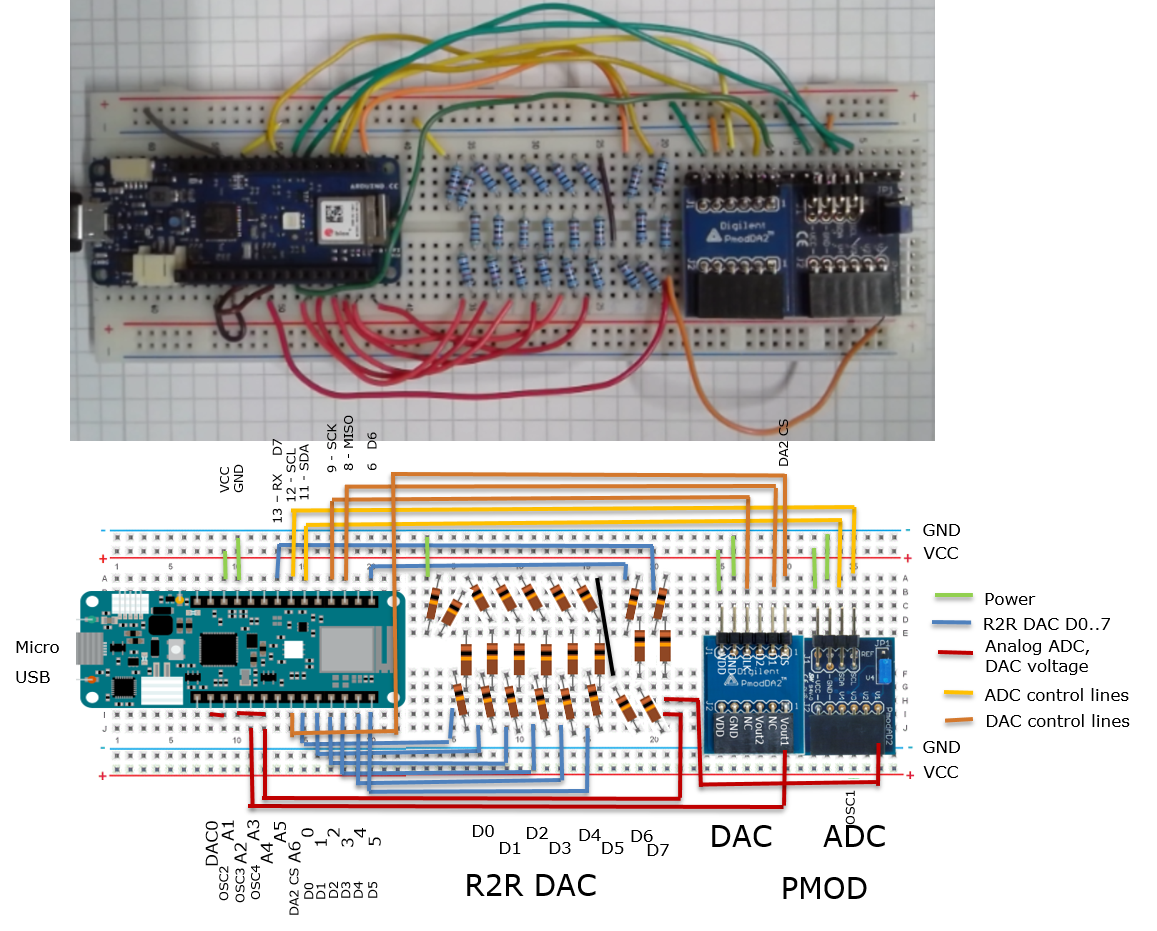
Target board Arduino MKR WIFI 1010
This sketch generates a sine signal with
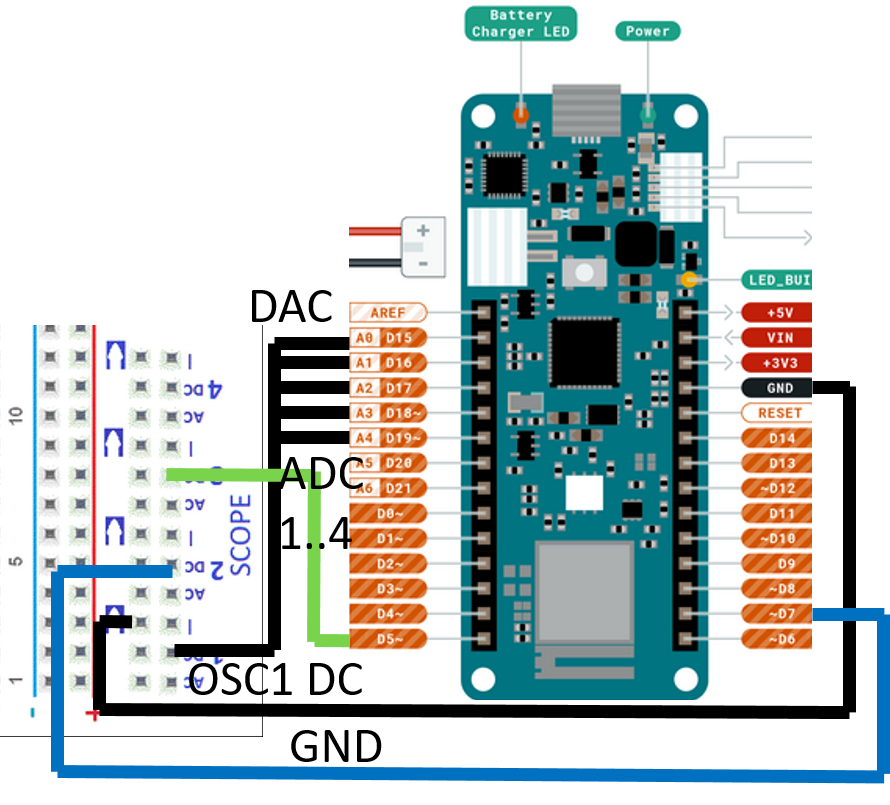
DAC: DAC0, AIN[0], PA02, A0, D15
PWL: AIN[7],PA07,A6,D21
Digital: PA22,23,10,11,PB10,11,PA20, PA21
This sketch samples:
OSC1: AIN[10], PB02, A1, D16
OSC2: AIN[11], PB03, A2, D17
OSC3: AIN[4], PA04, A3, D18
OSC4: AIN[5], PA05, A4, D19
Transfers 1024 values to serial port.
Setup:
Array of sine values is generated.
Loop:
4 times
1024 times
Set sine DAC, PWL, Digital
Read OSC1..4 to array
Transfer last 1024 values to serial port.
This example code is in the public domain.
Written 9 Sep 2020 by Joerg Vollrath
*/
#define DAC A0
#define DAC_D0 0
#define DAC_D1 1
#define DAC_D2 2
#define DAC_D3 3
#define DAC_D4 4
#define DAC_D5 5
#define DAC_D6 6
#define DAC_D7 13
#define DAC_PWM 8
#define ADC_OSC1 A1
#define ADC_OSC2 A2
#define ADC_OSC3 A3
#define ADC_OSC4 A4
// Sine wave lookup table 0..255 Sinbe.xlsx
uint16_t sineWave[] = {
128,131,134,137,140,143,146,149,152,155,158,162,165,167,170,173,
176,179,182,185,188,190,193,196,198,201,203,206,208,211,213,215,
218,220,222,224,226,228,230,232,234,235,237,238,240,241,243,244,
245,246,248,249,250,250,251,252,253,253,254,254,254,255,255,255,
255,255,255,255,254,254,254,253,253,252,251,250,250,249,248,246,
245,244,243,241,240,238,237,235,234,232,230,228,226,224,222,220,
218,215,213,211,208,206,203,201,198,196,193,190,188,185,182,179,
176,173,170,167,165,162,158,155,152,149,146,143,140,137,134,131,
128,124,121,118,115,112,109,106,103,100,97,93,90,88,85,82,
79,76,73,70,67,65,62,59,57,54,52,49,47,44,42,40,
37,35,33,31,29,27,25,23,21,20,18,17,15,14,12,11,
10,9,7,6,5,5,4,3,2,2,1,1,1,0,0,0,
0,0,0,0,1,1,1,2,2,3,4,5,5,6,7,9,
10,11,12,14,15,17,18,20,21,23,25,27,29,31,33,35,
37,40,42,44,47,49,52,54,57,59,62,65,67,70,73,76,
79,82,85,88,90,93,97,100,103,106,109,112,115,118,121,124
};
// Buffer for ADC values of 4 channels
uint16_t osc1[] = {
0,0,0,0,0,0,0,0,0,0,0,0,0,0,0,0,0,0,0,0,0,0,0,0,0,0,0,0,0,0,0,0,
0,0,0,0,0,0,0,0,0,0,0,0,0,0,0,0,0,0,0,0,0,0,0,0,0,0,0,0,0,0,0,0,
0,0,0,0,0,0,0,0,0,0,0,0,0,0,0,0,0,0,0,0,0,0,0,0,0,0,0,0,0,0,0,0,
0,0,0,0,0,0,0,0,0,0,0,0,0,0,0,0,0,0,0,0,0,0,0,0,0,0,0,0,0,0,0,0,
0,0,0,0,0,0,0,0,0,0,0,0,0,0,0,0,0,0,0,0,0,0,0,0,0,0,0,0,0,0,0,0,
0,0,0,0,0,0,0,0,0,0,0,0,0,0,0,0,0,0,0,0,0,0,0,0,0,0,0,0,0,0,0,0,
0,0,0,0,0,0,0,0,0,0,0,0,0,0,0,0,0,0,0,0,0,0,0,0,0,0,0,0,0,0,0,0,
0,0,0,0,0,0,0,0,0,0,0,0,0,0,0,0,0,0,0,0,0,0,0,0,0,0,0,0,0,0,0,0
};
uint16_t osc2[] ={
0,0,0,0,0,0,0,0,0,0,0,0,0,0,0,0,0,0,0,0,0,0,0,0,0,0,0,0,0,0,0,0,
0,0,0,0,0,0,0,0,0,0,0,0,0,0,0,0,0,0,0,0,0,0,0,0,0,0,0,0,0,0,0,0,
0,0,0,0,0,0,0,0,0,0,0,0,0,0,0,0,0,0,0,0,0,0,0,0,0,0,0,0,0,0,0,0,
0,0,0,0,0,0,0,0,0,0,0,0,0,0,0,0,0,0,0,0,0,0,0,0,0,0,0,0,0,0,0,0,
0,0,0,0,0,0,0,0,0,0,0,0,0,0,0,0,0,0,0,0,0,0,0,0,0,0,0,0,0,0,0,0,
0,0,0,0,0,0,0,0,0,0,0,0,0,0,0,0,0,0,0,0,0,0,0,0,0,0,0,0,0,0,0,0,
0,0,0,0,0,0,0,0,0,0,0,0,0,0,0,0,0,0,0,0,0,0,0,0,0,0,0,0,0,0,0,0,
0,0,0,0,0,0,0,0,0,0,0,0,0,0,0,0,0,0,0,0,0,0,0,0,0,0,0,0,0,0,0,0
};
uint16_t osc3[] = {
0,0,0,0,0,0,0,0,0,0,0,0,0,0,0,0,0,0,0,0,0,0,0,0,0,0,0,0,0,0,0,0,
0,0,0,0,0,0,0,0,0,0,0,0,0,0,0,0,0,0,0,0,0,0,0,0,0,0,0,0,0,0,0,0,
0,0,0,0,0,0,0,0,0,0,0,0,0,0,0,0,0,0,0,0,0,0,0,0,0,0,0,0,0,0,0,0,
0,0,0,0,0,0,0,0,0,0,0,0,0,0,0,0,0,0,0,0,0,0,0,0,0,0,0,0,0,0,0,0,
0,0,0,0,0,0,0,0,0,0,0,0,0,0,0,0,0,0,0,0,0,0,0,0,0,0,0,0,0,0,0,0,
0,0,0,0,0,0,0,0,0,0,0,0,0,0,0,0,0,0,0,0,0,0,0,0,0,0,0,0,0,0,0,0,
0,0,0,0,0,0,0,0,0,0,0,0,0,0,0,0,0,0,0,0,0,0,0,0,0,0,0,0,0,0,0,0,
0,0,0,0,0,0,0,0,0,0,0,0,0,0,0,0,0,0,0,0,0,0,0,0,0,0,0,0,0,0,0,0
};
uint16_t osc4[] = {
0,0,0,0,0,0,0,0,0,0,0,0,0,0,0,0,0,0,0,0,0,0,0,0,0,0,0,0,0,0,0,0,
0,0,0,0,0,0,0,0,0,0,0,0,0,0,0,0,0,0,0,0,0,0,0,0,0,0,0,0,0,0,0,0,
0,0,0,0,0,0,0,0,0,0,0,0,0,0,0,0,0,0,0,0,0,0,0,0,0,0,0,0,0,0,0,0,
0,0,0,0,0,0,0,0,0,0,0,0,0,0,0,0,0,0,0,0,0,0,0,0,0,0,0,0,0,0,0,0,
0,0,0,0,0,0,0,0,0,0,0,0,0,0,0,0,0,0,0,0,0,0,0,0,0,0,0,0,0,0,0,0,
0,0,0,0,0,0,0,0,0,0,0,0,0,0,0,0,0,0,0,0,0,0,0,0,0,0,0,0,0,0,0,0,
0,0,0,0,0,0,0,0,0,0,0,0,0,0,0,0,0,0,0,0,0,0,0,0,0,0,0,0,0,0,0,0,
0,0,0,0,0,0,0,0,0,0,0,0,0,0,0,0,0,0,0,0,0,0,0,0,0,0,0,0,0,0,0,0
};
uint16_t bitsX[] = {1,2,4,8,16,32,64,128};
void setup() {
// put your setup code here, to run once:
pinMode(DAC_D0, OUTPUT);
pinMode(DAC_D1, OUTPUT);
pinMode(DAC_D2, OUTPUT);
pinMode(DAC_D3, OUTPUT);
pinMode(DAC_D4, OUTPUT);
pinMode(DAC_D5, OUTPUT);
pinMode(DAC_D6, OUTPUT);
pinMode(DAC_D7, OUTPUT);
// initialize serial communication at 115200
Serial.begin(115200);
Serial.println("\r\nData Converter Sine Test");
}
// Setting 8 digital outputs for R2R DAC
void digWrite(uint16_t sineValue){
// It takes some time (20us?) to set all pins
// Settling tim emeasurements will be skewed
if ((sineValue & bitsX[0]) == bitsX[0] ) {
digitalWrite(DAC_D0, HIGH);
} else {
digitalWrite(DAC_D0, LOW);
}
if ((sineValue & bitsX[1]) == bitsX[1] ) {
digitalWrite(DAC_D1, HIGH);
} else {
digitalWrite(DAC_D1, LOW);
}
if ((sineValue & bitsX[2]) == bitsX[2] ) {
digitalWrite(DAC_D2, HIGH);
} else {
digitalWrite(DAC_D2, LOW);
}
if ((sineValue & bitsX[3]) == bitsX[3] ) {
digitalWrite(DAC_D3, HIGH);
} else {
digitalWrite(DAC_D3, LOW);
}
if ((sineValue & bitsX[4]) == bitsX[4] ) {
digitalWrite(DAC_D4, HIGH);
} else {
digitalWrite(DAC_D4, LOW);
}
if ((sineValue & bitsX[5]) == bitsX[5] ) {
digitalWrite(DAC_D5, HIGH);
} else {
digitalWrite(DAC_D5, LOW);
}
if ((sineValue & bitsX[6]) == bitsX[6] ) {
digitalWrite(DAC_D6, HIGH);
} else {
digitalWrite(DAC_D6, LOW);
}
if ((sineValue & bitsX[7]) == bitsX[7] ) {
digitalWrite(DAC_D7, HIGH);
} else {
digitalWrite(DAC_D7, LOW);
}
}
void loop() {
// put your main code here, to run repeatedly:
// 4 periods
for (int i2 = 0; i2 < 4; i2++) {
// 256 samples written and read
for (int i1 = 0; i1 < 256; i1++) {
// writing Analog
analogWrite(DAC, sineWave[i1]);
// writing PWM
analogWrite(DAC_PWM, sineWave[i1]);
// writing digital
digWrite(sineWave[i1]);
// reading analog
osc1[i1] = analogRead(ADC_OSC1);
osc2[i1] = analogRead(ADC_OSC2);
osc3[i1] = analogRead(ADC_OSC3);
osc4[i1] = analogRead(ADC_OSC4);
}
}
// transfer data to PC via serial interface
Serial.println("New block: ");
for (int i3 = 0; i3 < 256; i3++) {
Serial.print(i3);
Serial.print(" , Sine = ");
Serial.print(sineWave[i3]);
Serial.print(" , ADC(OSC1) = ");
Serial.print(osc1[i3]);
Serial.print(" , ADC(OSC2) = ");
Serial.print(osc2[i3]);
Serial.print(" , ADC(OSC3) = ");
Serial.print(osc3[i3]);
Serial.print(" , ADC(OSC4) = ");
Serial.println(osc4[i3]);
}
delay(10);
}