Interface ElectronicsLaboratory 02: LTSPICE DAC analysis instructionsProf. Jörg VollrathStart 9.11.2026 |

|
SH Error Theory
| OpAmp Voltage follower | Switch CLK coupling SampleHold C1 |
Switch RC SampleHold R5 |
| \( \frac{V_{out}}{V_{in}}=\frac{1}{1+\frac{1}{v(f)}} \) | \( dV = VDD \frac{1}{(1+\frac{C_S}{C_1})} \) | t > RC (B+1) ln(2) |
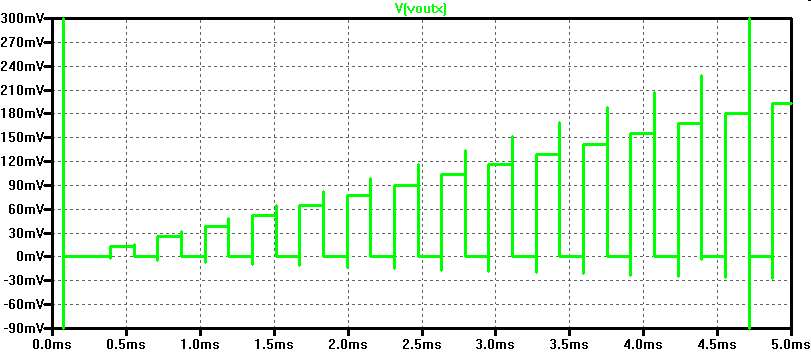
The accuracy of the voltage follower is dependent on the voltage gain which is depending
on the frequency.
\( \frac{V_{out}}{V_{in}} = \frac{1}{1+\frac{1}{v(0.1 \cdot f_t)}} = \frac{1}{1+\frac{1}{10}} = \frac{1}{1.1} = 0.9 \)
The CLK signals couples to the sample and hold voltage.
The switch on time limits the possible voltage swing with the RC time constant.
A sine signal test can have worse SNR results for higher frequencies.
A normal ramp signal test has small step size and will only show CLK coupling.
A pulsed ramp test with 0V or VDD between consecutive cycles can show all the error contributions.
\( \frac{V_{out}}{V_{in}} = \frac{1}{1+\frac{1}{v(0.1 \cdot f_t)}} = \frac{1}{1+\frac{1}{10}} = \frac{1}{1.1} = 0.9 \)
The CLK signals couples to the sample and hold voltage.
The switch on time limits the possible voltage swing with the RC time constant.
A sine signal test can have worse SNR results for higher frequencies.
A normal ramp signal test has small step size and will only show CLK coupling.
A pulsed ramp test with 0V or VDD between consecutive cycles can show all the error contributions.
Sample and Hold Simulation
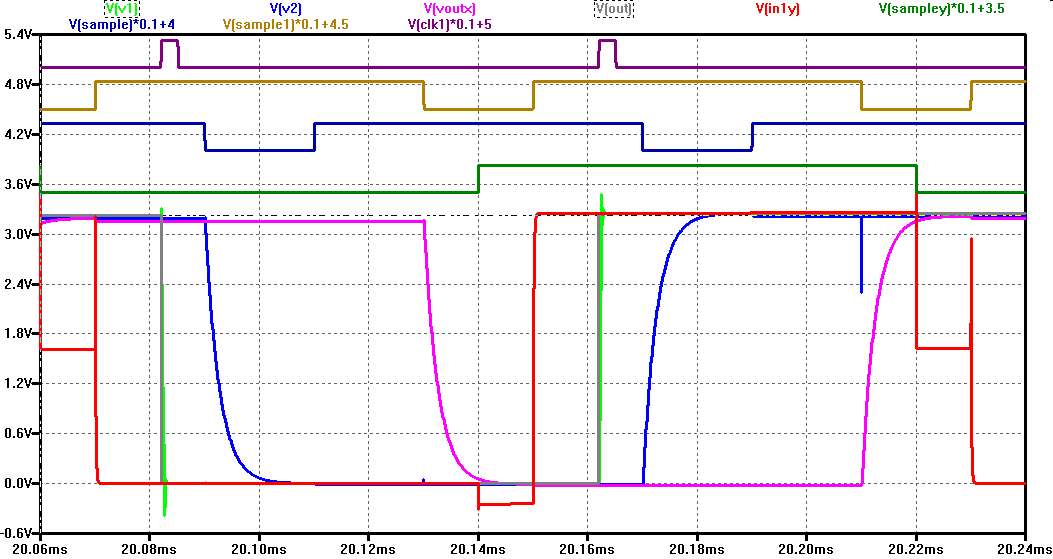
The analog signal V(in1y) (red) is the input to a DAC after a switch
between signal and GND. Control signal sampley coupling can be seen.
V(out) is the signal after the ADC, DAC combination going into the signal chain measurement.
V(v1) (green) shows the operational amplifier limit of 500ns rise/fall time.
V(V2) (blue) shows the RC (R5=50k) time constant of the switch and the sampling capacitance Cs=50pF and the coupling of V(sample) via C1=1pF. V(sample1) creates a short spike.
V(voutx) (pink) shows the same time constant at the output.
For a given circuit only the pulse time for the switch and the sampling capacitance can be varied.
The maximum sampling capacitance is limited by the drive capability of the operational amplifier.
The step period is 160E-6
Sampling is controlled via the start parameter assuming the change of V(v1) happens at 0ns:
V(in1y, red) can be sampled during the second half of the period start: 0..80E-6
V(v1, green) can be sampled 10us later during the second half of the period start: 10..90E-6
V(v2, blue) can be sampled 20us later during the second half of the period and switch ctrl signal is high again, switch is open start: 40..120E-6
Preferable before the next switch is activated: 50E-6.
V(voutx) can be sampled 80us later during the second half of the period: 120E-6.
A full documentation needs:
V(out) is the signal after the ADC, DAC combination going into the signal chain measurement.
V(v1) (green) shows the operational amplifier limit of 500ns rise/fall time.
V(V2) (blue) shows the RC (R5=50k) time constant of the switch and the sampling capacitance Cs=50pF and the coupling of V(sample) via C1=1pF. V(sample1) creates a short spike.
V(voutx) (pink) shows the same time constant at the output.
For a given circuit only the pulse time for the switch and the sampling capacitance can be varied.
The maximum sampling capacitance is limited by the drive capability of the operational amplifier.
Acquisition has to be controlled via the start, stop, step parameters.
For the example picture above a zero output is followed by the required level.The step period is 160E-6
Sampling is controlled via the start parameter assuming the change of V(v1) happens at 0ns:
V(in1y, red) can be sampled during the second half of the period start: 0..80E-6
V(v1, green) can be sampled 10us later during the second half of the period start: 10..90E-6
V(v2, blue) can be sampled 20us later during the second half of the period and switch ctrl signal is high again, switch is open start: 40..120E-6
Preferable before the next switch is activated: 50E-6.
V(voutx) can be sampled 80us later during the second half of the period: 120E-6.
A full documentation needs:
| ramp | V(node) | start | stop | step | INL min, max | DNL min, max | File name |
| 327.68m | |||||||
| 327.68m rtz |
| sine frequency | sine periods | V(node) | start | stop | step | Signal magnitude | Total noise magnitude | Harmonics | Total noise magnitude without harmonics | File name |
| 16.78466796875 | 11 |