How to create web report
- Use template which is available here
- Change: Title, Name, slide footer
- Copy div class "slide" for slide content
- Content in div class "handout" is not on the slides displayed
- Insert Images like this:

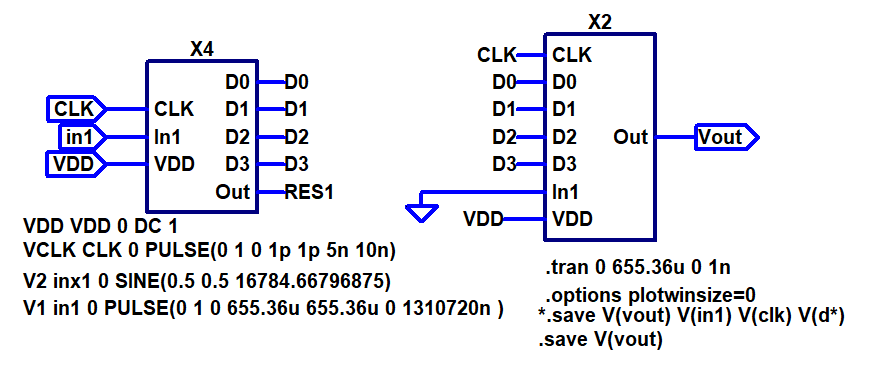
- Insert LTSpice Schematic like this:

- -> Spice operation commands are not displayed with this method
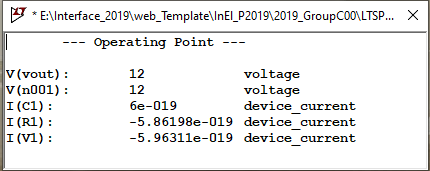
LTSPICE_Operating_Point_Analysis
|
|
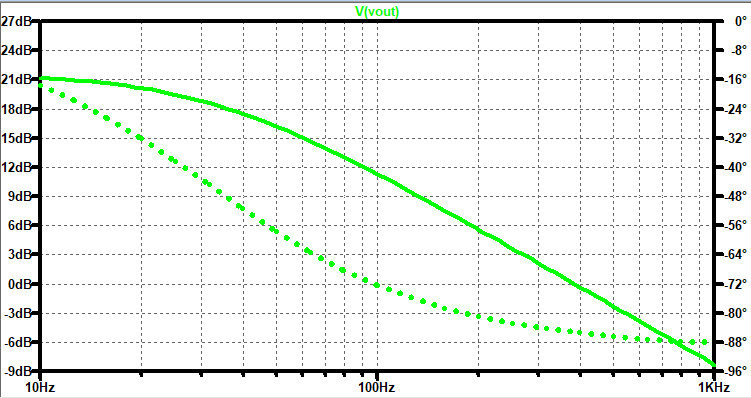
LTSPICE_AC_Analysis
|
|
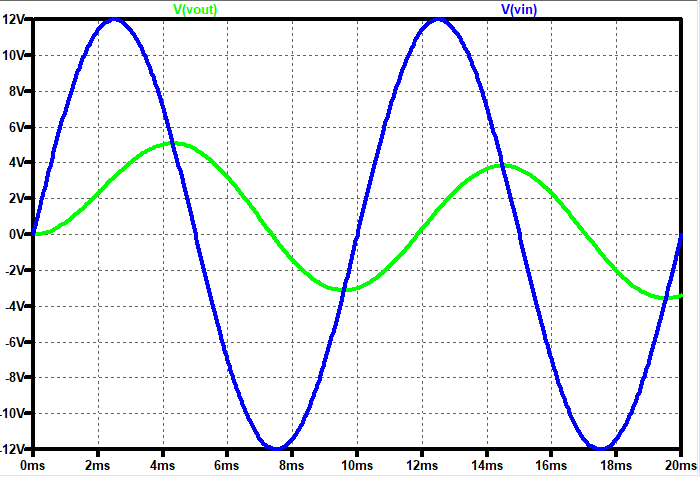
LTSPICE_Transient_Analysis
|
|
ADC_DAC_Ramp_Simulation
|
|
ADC_DAC_Ramp_Simulation
|
|
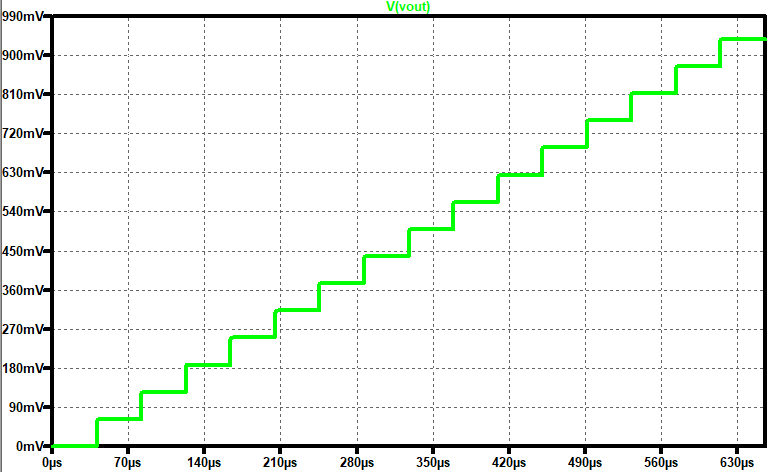
DAC_Data_Analysis
|
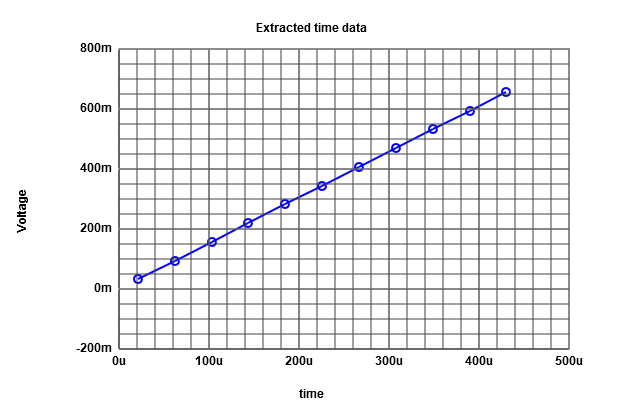 figure1
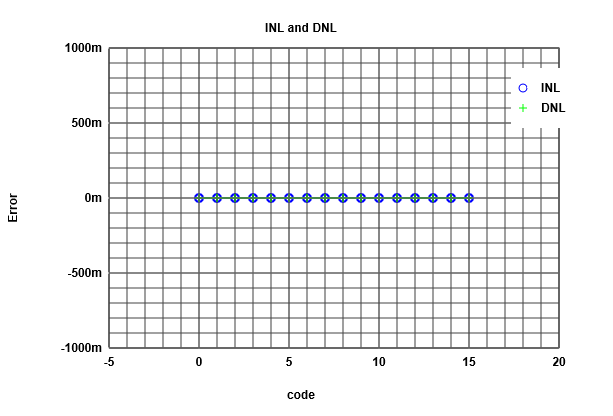 figure2
|
ADC_Sine_Data_Analysis
|
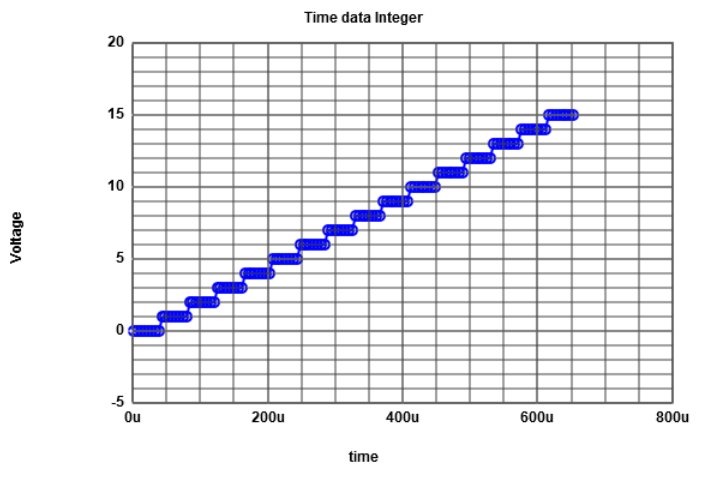 figure1
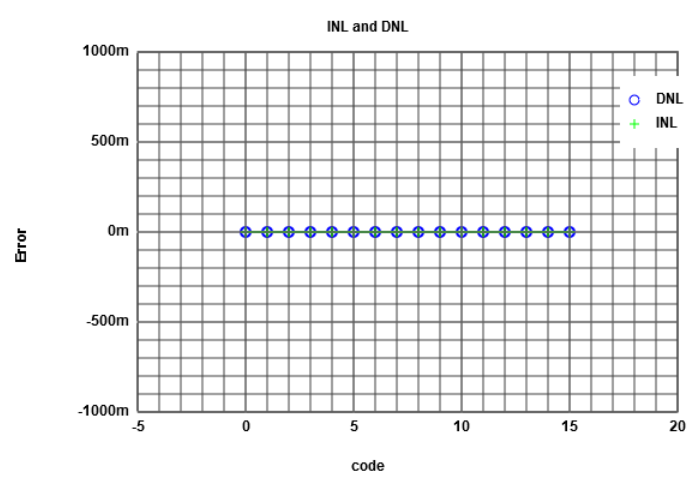 figure2
|
ADC_Sine_Data_Analysis
|
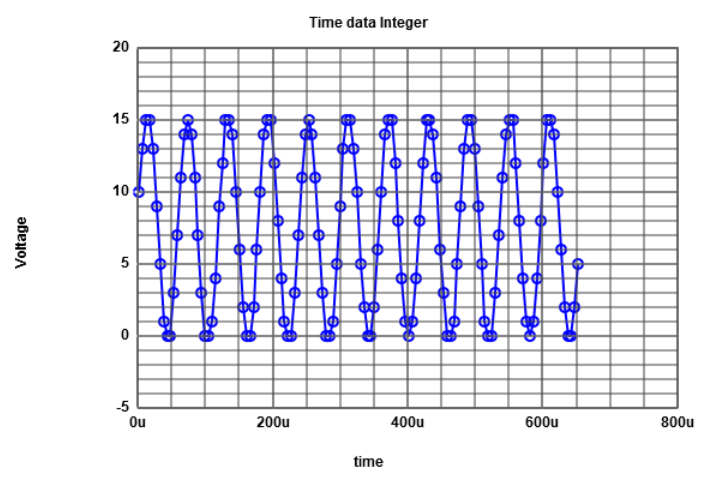 figure1
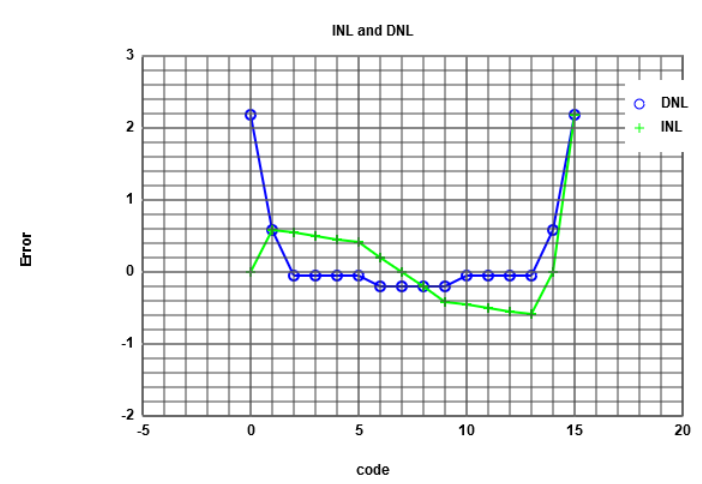 figure2
|
ADC_Sine_FFT
|
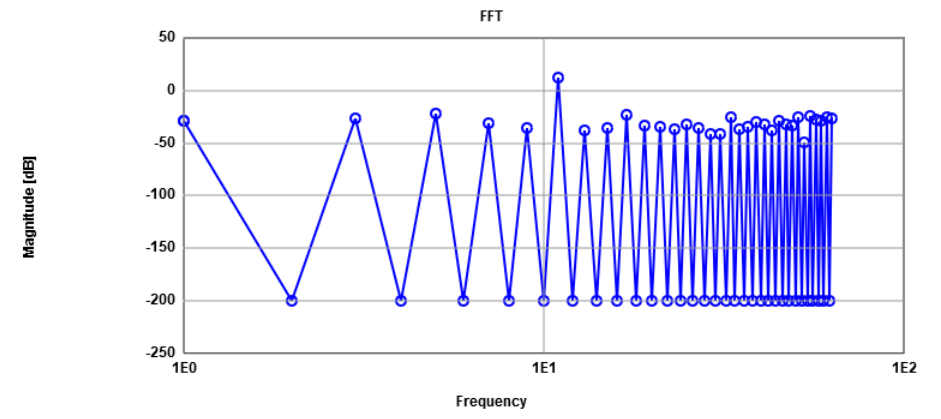 figure1
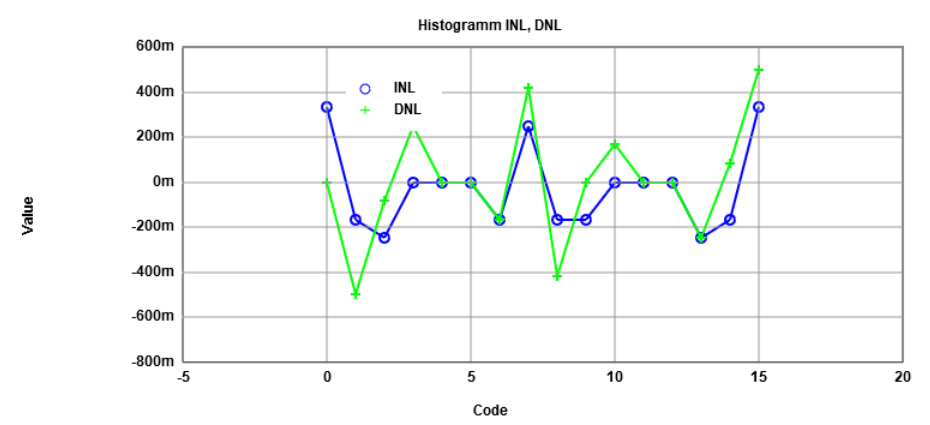 figure2
|
R2R_DAC_Sine
|
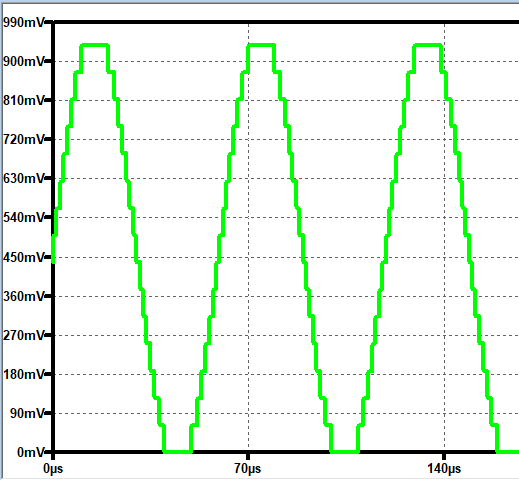 figure1
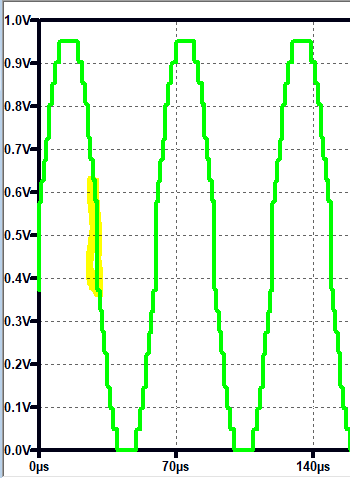 figure2
|
R2R_DAC_Sine FFT
|
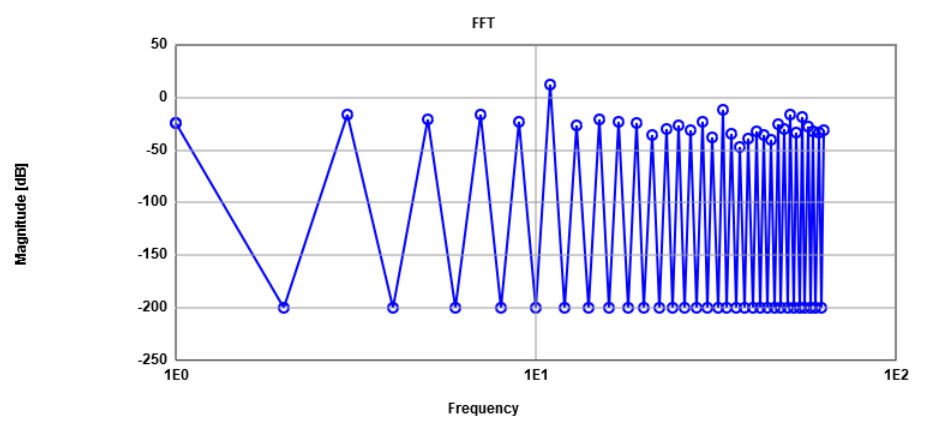 figure1
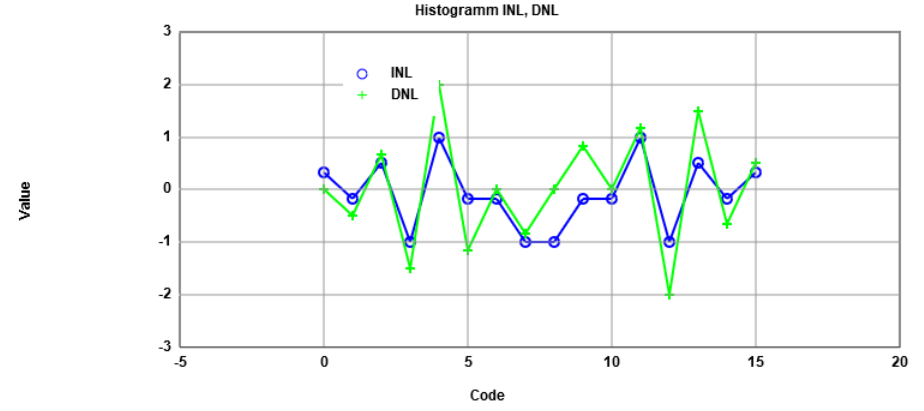 figure2
|
R2R_DAC_Ramp
|
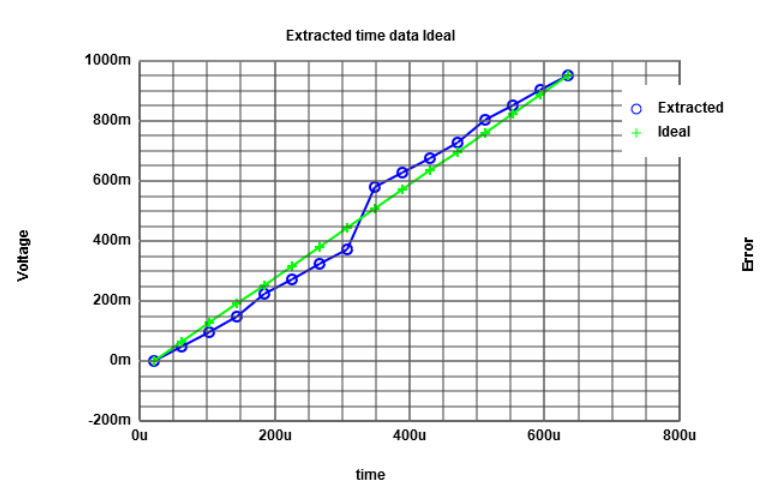 figure1
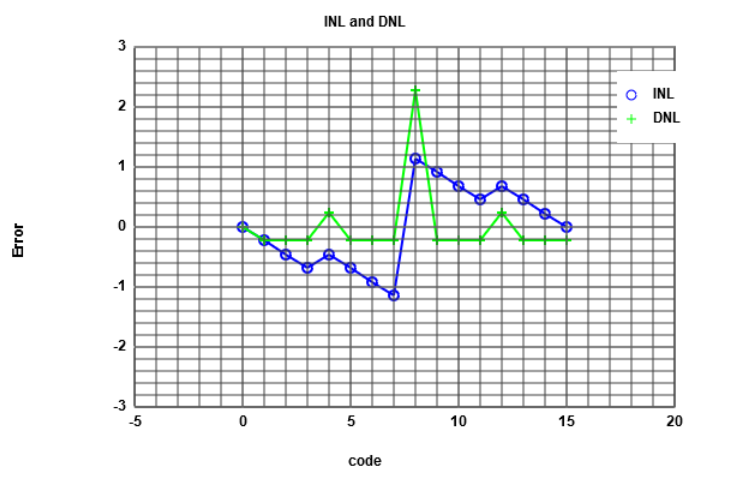 figure2
|