ADC-DAC schematic
|
The first part is to build an ideal ADC connected to an DAC in LTSPICE like shows in (schematic), then we simulate the circuit for a Ramp
and for sine signals After building the circuit in LTSPICE, we run the Simulation for a sine and Ramp sine signals. We have got an output of 11 period for the sine signal . We can also got an FFT in LTSPICE. which is represented in the figure below. 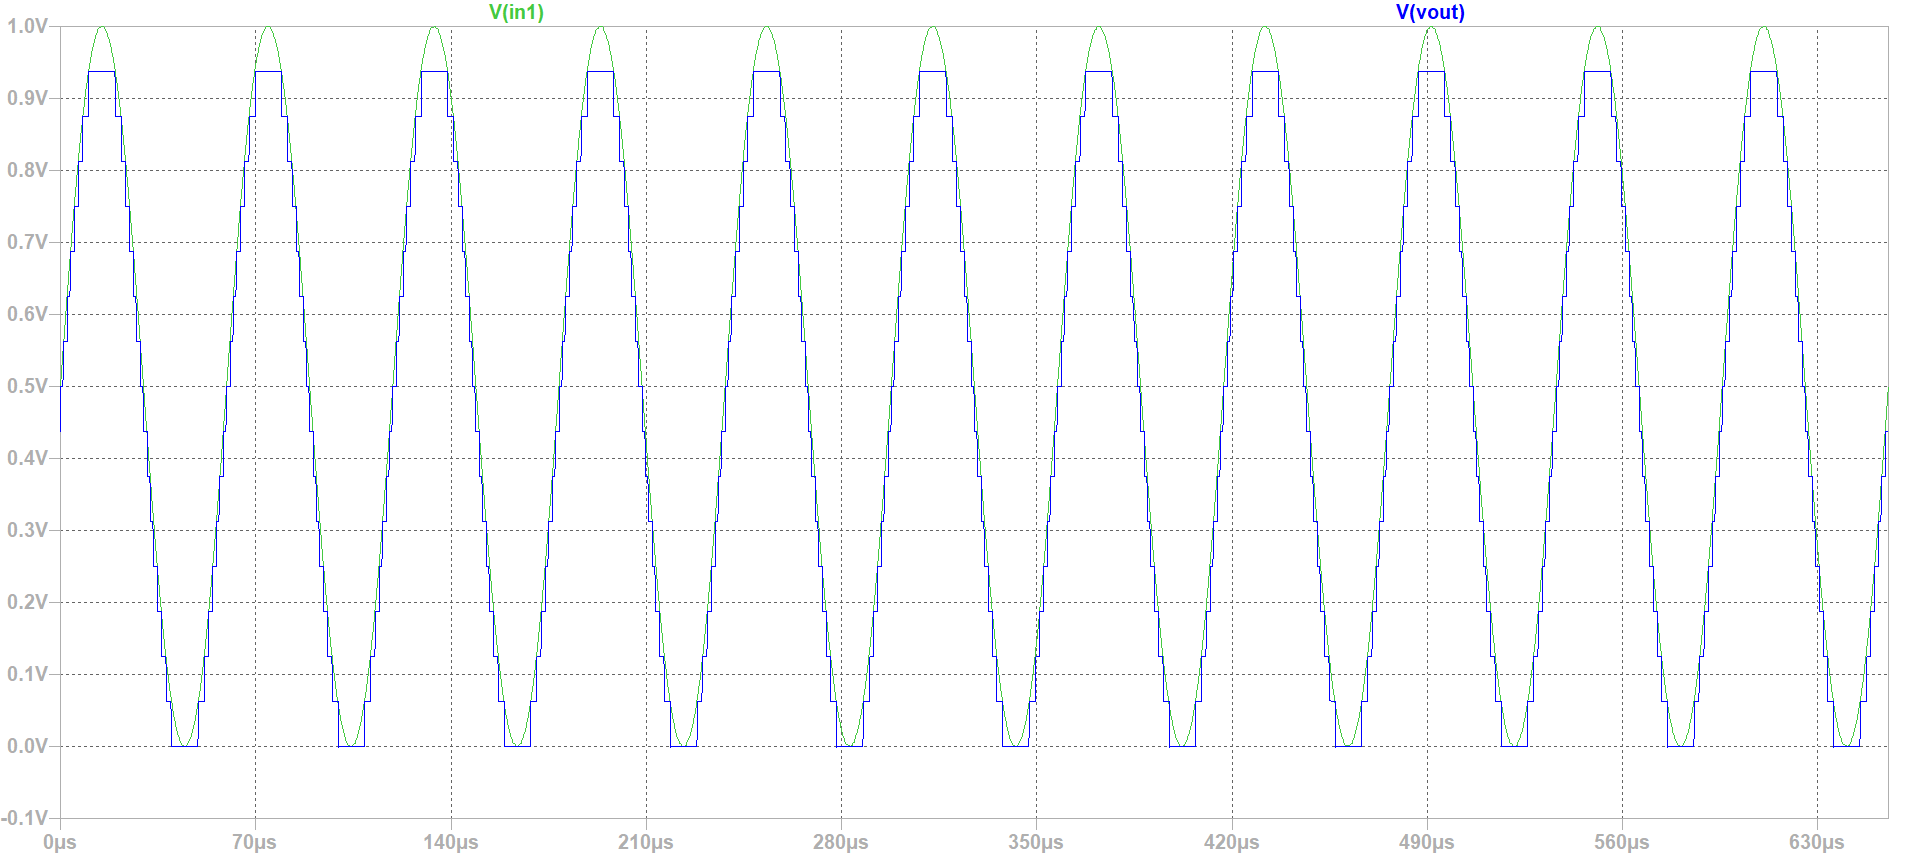 figure 1
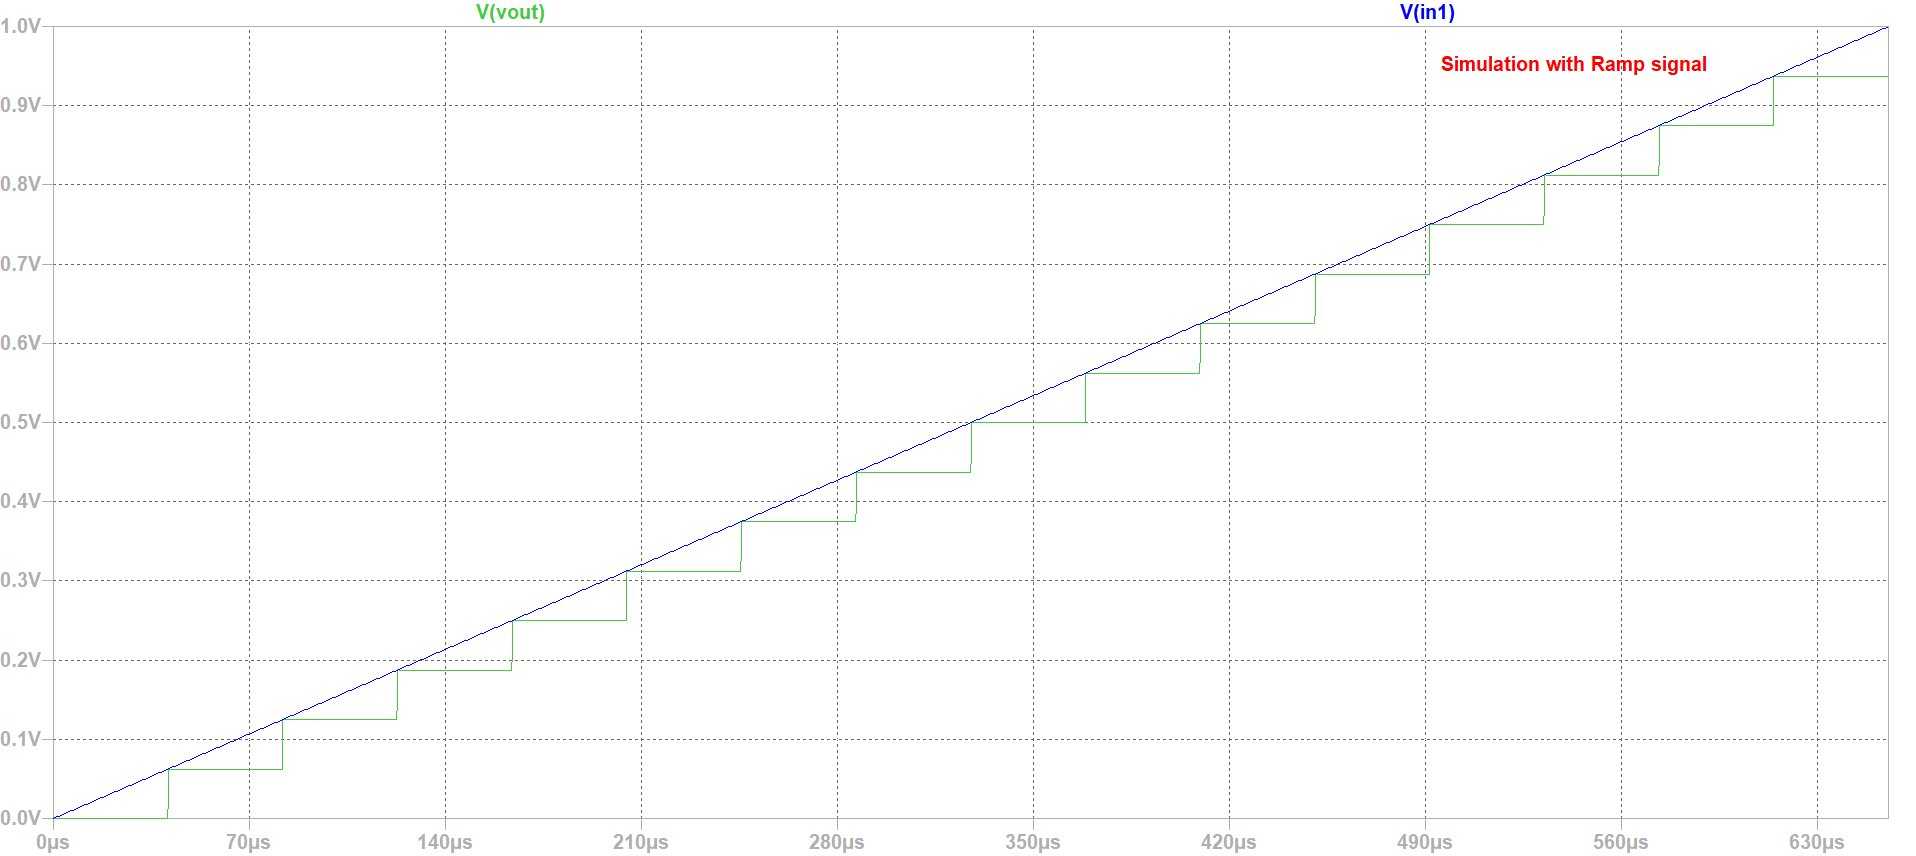 figure 2
|
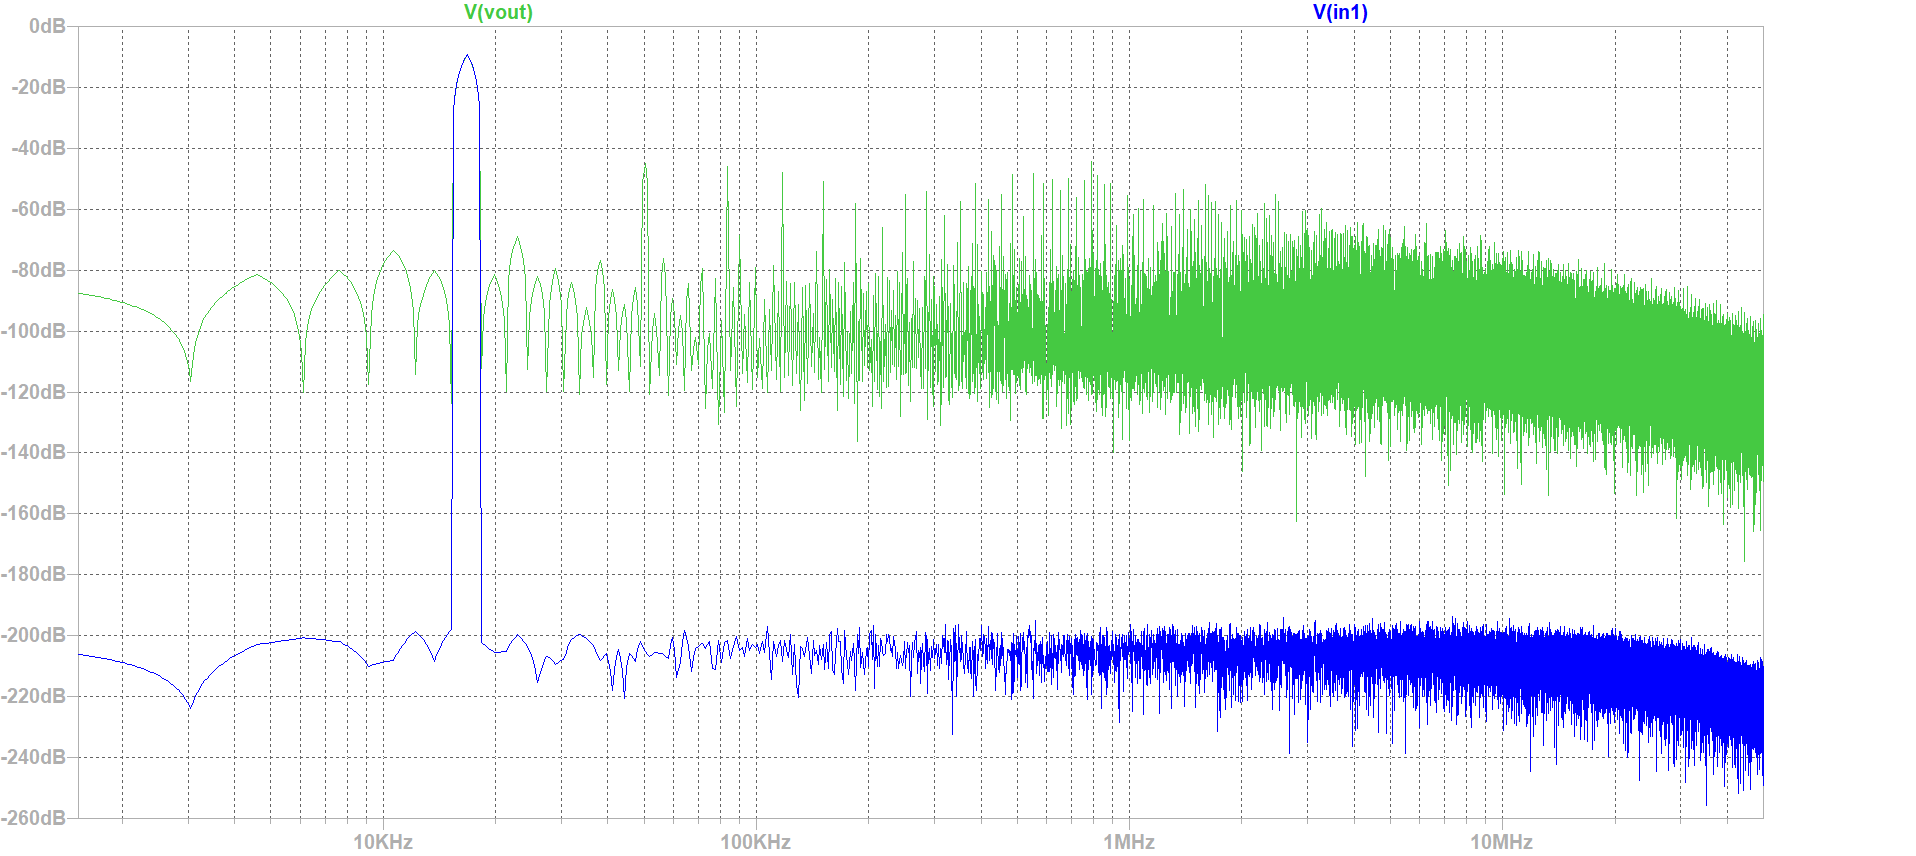 figure 3
|
INL, DNL FFT Tools Analysis
Simulation and Alaysis of 4-bits ADC DAC with Ramp Input Signal
|
After Runing the simulation of ADC-DAC in LTSPICE and by : using the Read Raw File, we could extract simulations values and graphs (Using Graphic inteface). Use analysis buttons to: * Show extracted values * Map values to integers * DAC INL, DNL analysis * ADC histogram analysis From INL-DNL figure we can easily figure out that there is no INL or DNL errors, and this is due to our Ideal Converter,and since it is an ideal converter it's obvious that the extracted output is identical to the ideal one. For this simulation we would like to analyze the histogram, thus we need more time steps (seeting:5.12 E-6) We have naturaly got an Ideal histogram test, since the coinverter is an Ideal one. About the DAC analyses we got some errors in our case, but this test is not useful. Fro the histofram graph, is an Ideal one (INL andDNL are zeros). 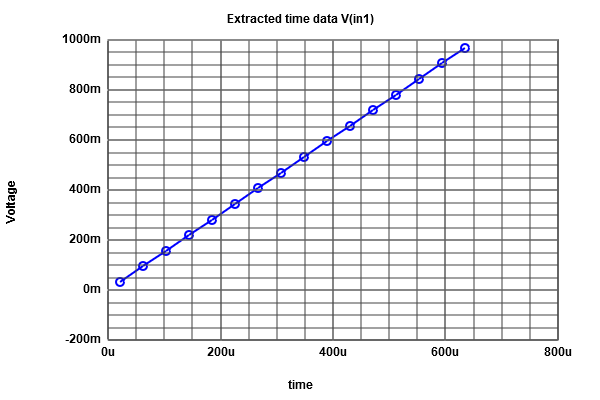 figure 4
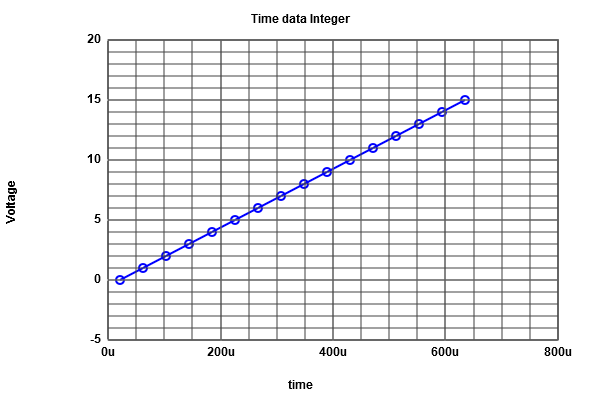 figure 5
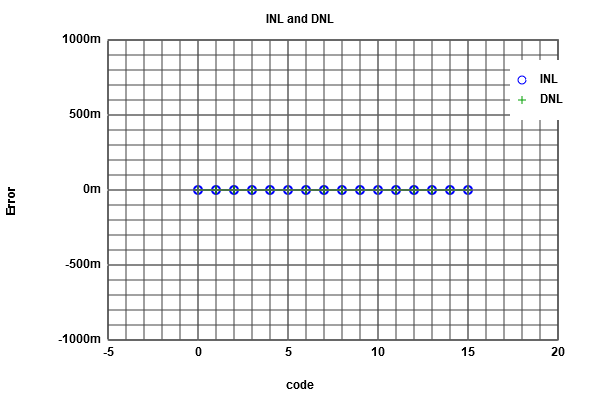 figure 6
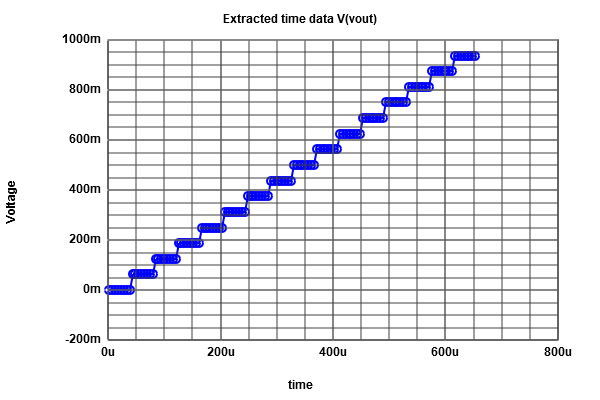 figure 7
|
Simulation and Alaysis of 4-bits ADC DAC with sine Input Signal
|
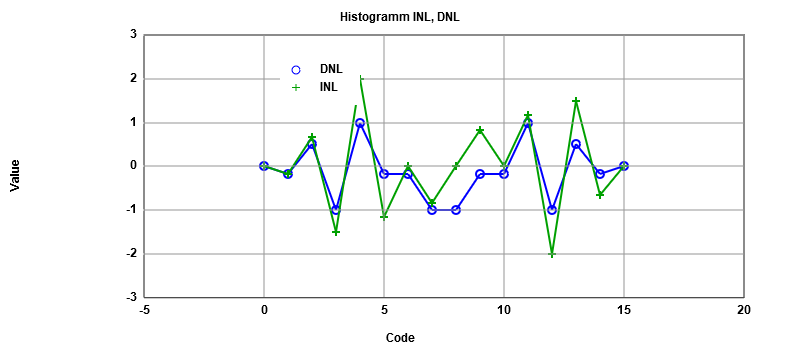
We do the same previous work for (Ramp input), but now we do it for (sine input). From the extracted Data, we can figure out that the number of data is 16 in each level. From the ADC histogram test, we have got our INL and DNL errors curve (which have a typical sine form). The next step is an FFT analyses (we always use the graphical Java tool),after we introduce our Data, and read the positiv integer data. The FFT curve is produced with limited number of points. By changing the number of bits to 4, we get a real curve of INL and DNL as shown in (Figure 12), compared to the ILN , DNL (Figure 13). 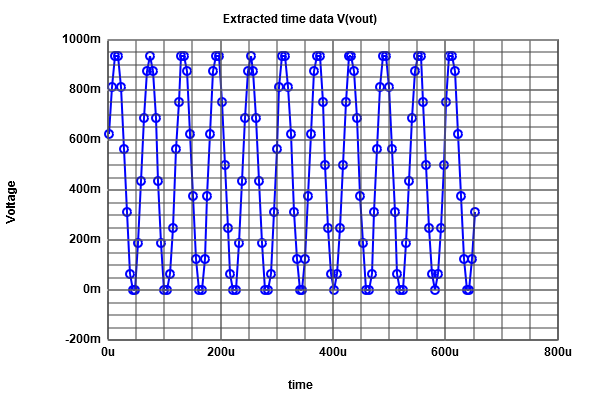 figure 8
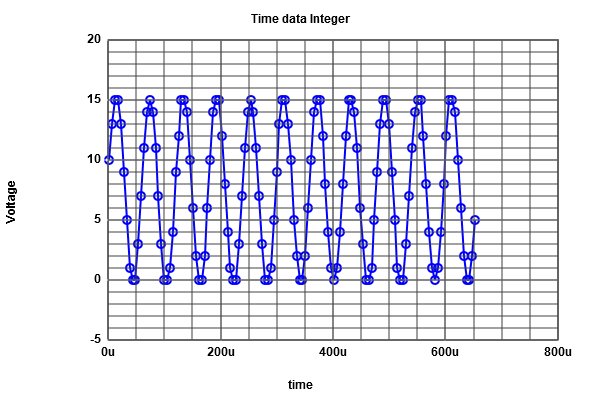 figure 9
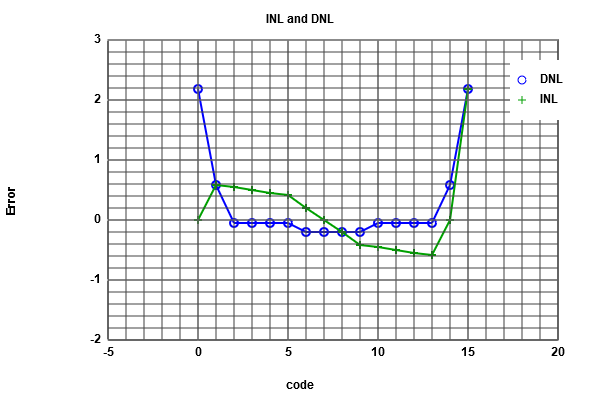 figure 10
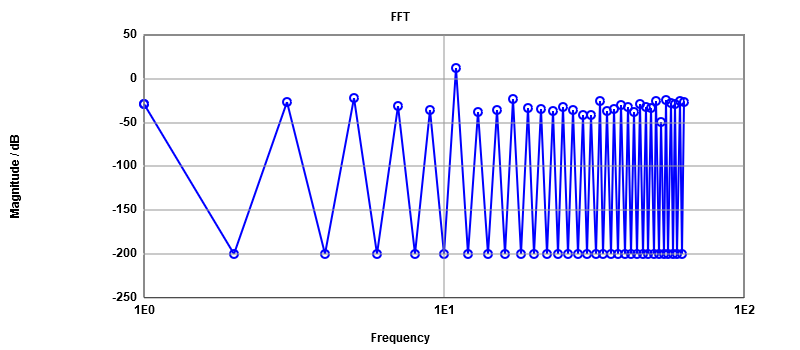 figure 11
 figure 12
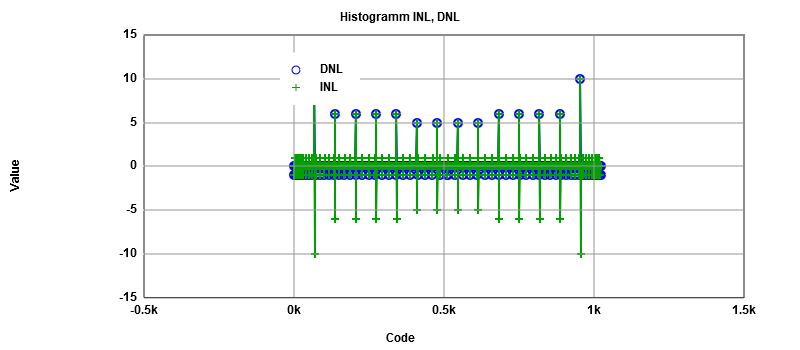 figure 13
Signal to noiseFrequency signal magnitude dB Total noise magnitude dBFrom this table, the number of bits can be calculated by subtracting the total signal noise from the singal noise and then dividing the result by 6. the result is 4 bits (no missing code). 11 11.87 -13.89 5 -21.56 -14.7 17 -23.64 -15.3 55 -24.16 -15.9 61 -25 -16.47 51 -25.62 -17.04 33 -25.67 -17.68 63 -26.33 -18.31 3 -26.86 -18.96 57 -27.66 -19.59 1 -28.4 -20.21 |
Simulation R2R DAC
|
We are using a real circuit in this simulation,and the goal is to see some errors. The values of resistances were changed (D3 to 1.5K) and (D1 to 1.3K),therfore many changes will accure in Vout curve. From the curve below, it is clear that we have jump of the voltage in the middle (the errors are clear from the Vout curve) 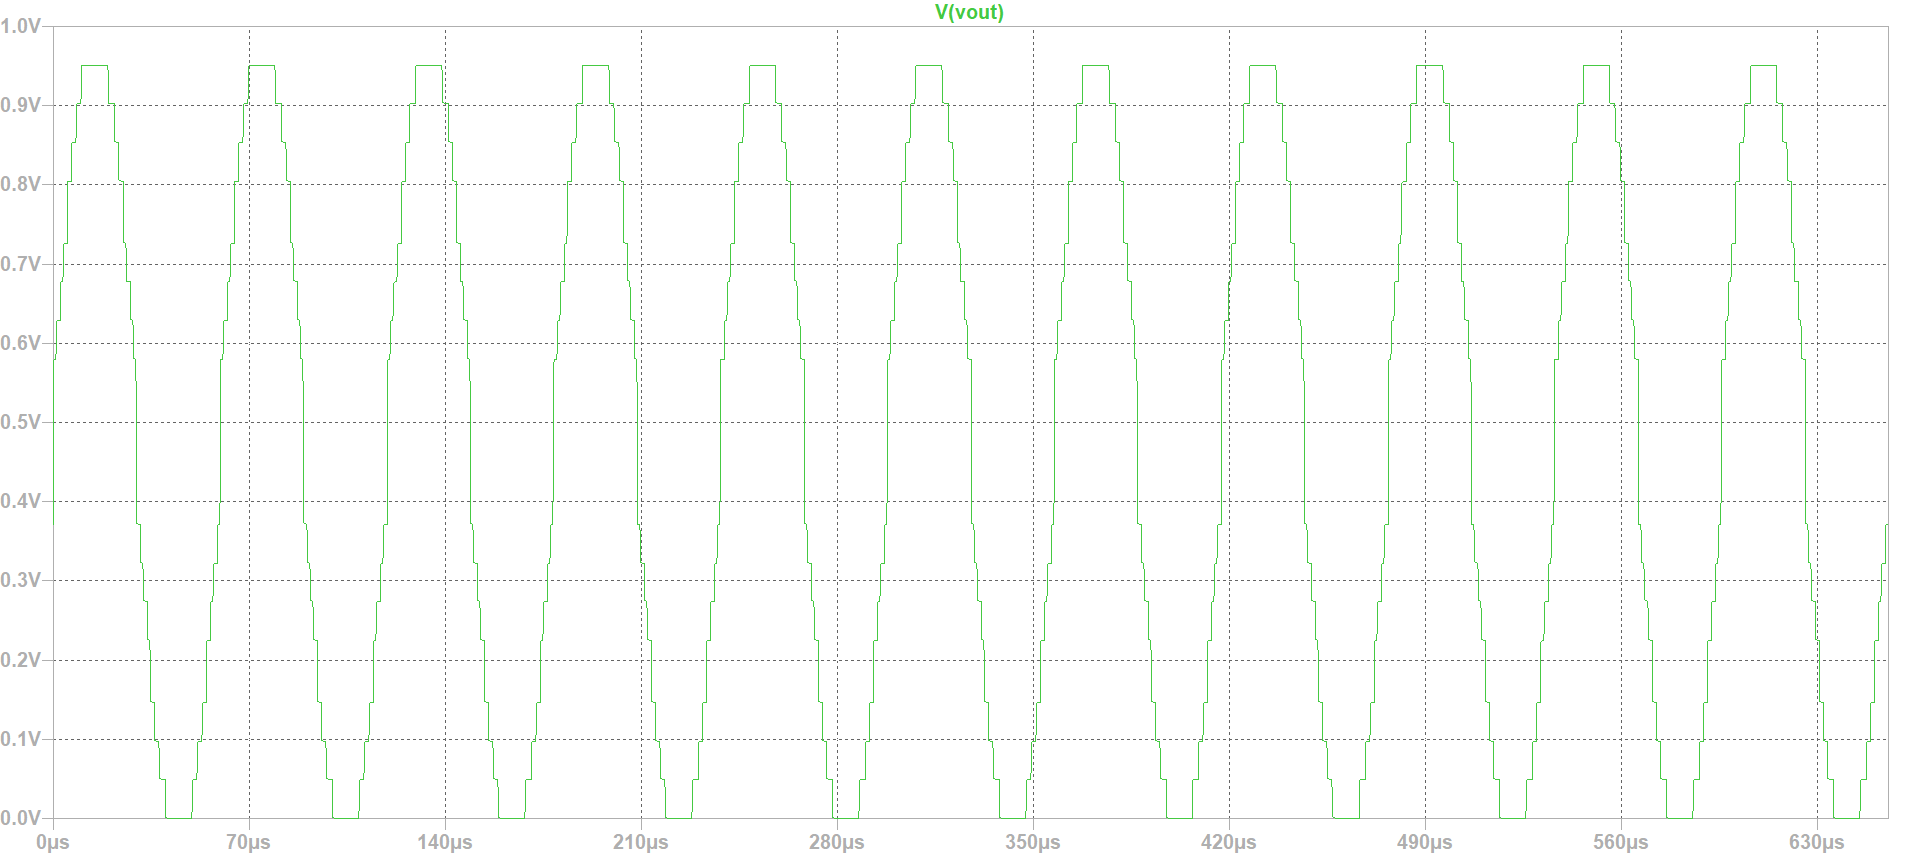
|
FFT analyses on Real ADC-DAC
It is clear from our INL/DNL curve that the error is greater than one, which mean we are dealing with a real converter.
Frequency signal magnitude dB Total noise magnitude dB
From this table, the number of bits can be calculated, subtracting the total signal noise from the singal noise and then dividing the result by 6,the result is 3 bits which means that one bit is missing due to the occured errors.
11 85.01 65.44
33 62.38 62.48
51 54.45 61.74
7 54.38 60.85
5 52.21 60.21
29 52.03 59.5
3 51.28 58.79
17 50.64 58.07
15 49.33 57.44
1 49.02 56.77
55 48.56 56.06