Simulation of ramp signal at 4Bit_ADC_DAC_pipe.asc
Open the circuit "4Bit_ADC_DAC_pipe.asc" with LTSPICE.
Add a voltage source and modifie it to a PULSE source with the following preferences:
- Vinitial[V] = 0, Von[V] = 1, Tdelay[s] = 0, Trise[s] = 655.36u, Tfall[s] = 655.36u, Ton[s] = 0, Tperiod[s] = 1310.72u
- V1 in1 0 PULSE(0 1 0 655.36u 655.36u 0 1310.72u)
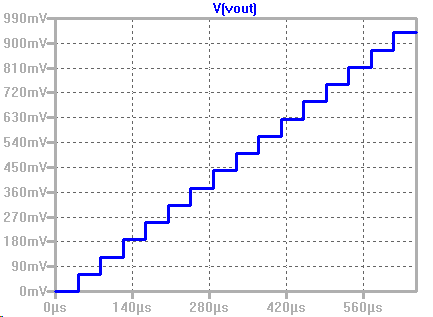
Simulate the circuit and look at the voltages in1 and Vout
You shold see a ramp at in1 and a stepped ramp at Vout
Change the save command, that only Vout is saved in the raw file.
Therefore you have to edit the command ".save V(in1) V(vout)" into ".save V(vout)"
Rerun the simulation.
Analyis of ramp signal at 4Bit_ADC_DAC_pipe.asc
Open the Interface Electonics webpage and goto "Lab03 ADC DAC Analysis"
Open at "ADC DAC Schematic" the Link "Read Raw File" in a new Tab.
Put in the following values:
- Start time: 0, Stop time: 655.35E-6, Time step: 40.96E-6
- Hint: Time / Time Step = Values 655.35 / 40.96 = 16
Notice that the raw file is either in the directory where the circuit is or its in a separate raw file directory of LTSPICE.
The browser will need some time to load the file and process the data.
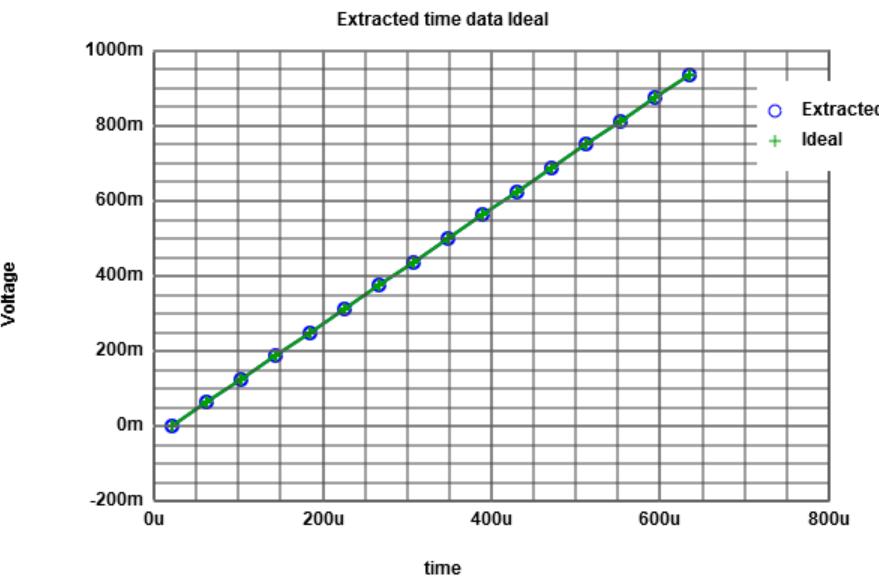
When your browser has loaded all the data you can see the voltage Vout over time
At "Measurement analysis, we can analize the data.
With the button "Extracted values" you can see the extracted values from the data.
In the table you can see the the Index, the time step and the vout voltage
With the button "Map to integer" you map the extracted values from 0 to the choosen number 15.
In the table you get the mapped numbers from 0 to 15. In the second graph you see the mapped values.
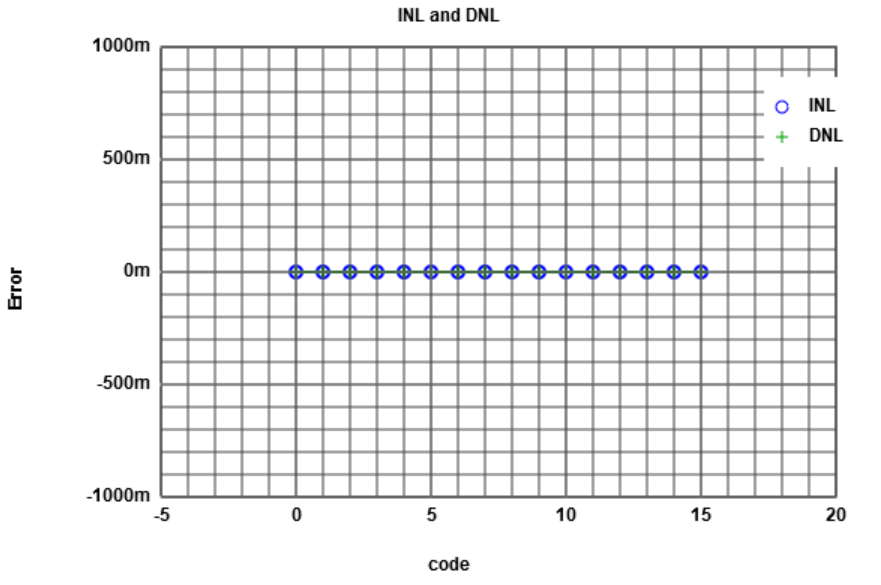
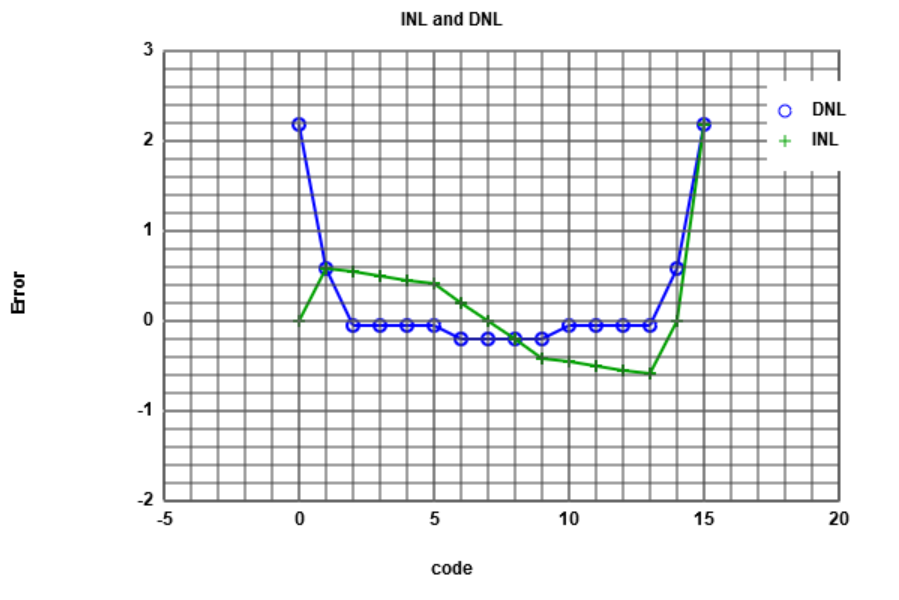
With the button "DAC INL, DNL analysis" you get the INL and DNL of the data.
In the table you can see now the code, real value, ideal value, INL and DNL.
Extracted values:
sgTable:
0,0.00002088899891196564,0
1,0.000061849,0.0625
2,0.00010280830221277951,0.125
3,0.00014376631263999474,0.1875
4,0.00018472905662087196,0.25
5,0.00022568957400001326,0.3125
6,0.000266649,0.375
7,0.000307609,0.4375
8,0.00034856930145547876,0.5
9,0.0003895291194667695,0.5625
10,0.00043048623927005776,0.625
11,0.000471449,0.6875
12,0.0005124087791431906,0.75
13,0.0005533690000000001,0.8125
14,0.000594329,0.875
15,0.0006352850861390594,0.9375
LSB calculation:
LSB = (V(15)-V(0))/(2^4-1) = ((0.9375-0)/(2^4-1) = 0.0625 V
Simulation of sine signal at 4Bit_ADC_DAC_pipe.asc
Open the circuit "4Bit_ADC_DAC_pipe.asc" with LTSPICE.
Modify the sine voltage V2 that this voltage source is in use, disable the pulse source.
- V2 in1 0 SINE(0.5 0.5 16784.66796875)
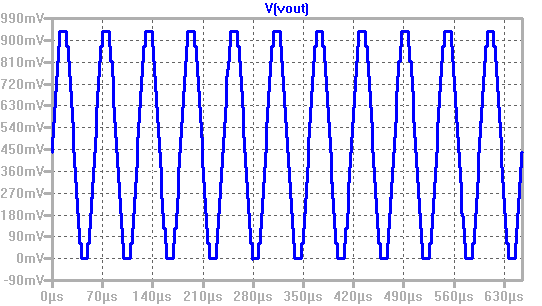
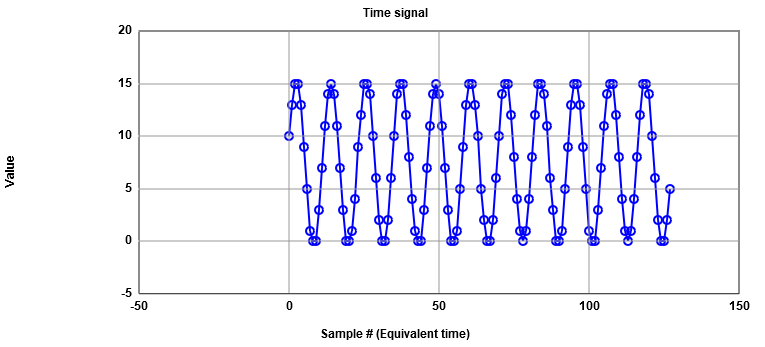
Simulate the circuit and look at the voltages in1 and Vout
You shold see a sine at in1 and a stepped sine at Vout
Change the save command, that only Vout is saved in the raw file.
Therefore you have to edit the command ".save V(in1) V(vout)" into ".save V(vout)"
Rerun the simulation.
Analysis of sine signal at 4Bit_ADC_DAC_pipe.asc
Open the Interface Electonics webpage and goto "Lab03 ADC DAC Analysis"
Open at "ADC DAC Schematic" the Link "Read Raw File" in a new Tab.
Put in the following values:
- Start time: 0, Stop time: 655.35E-6, Time step: 5.12E-6
- Hint: Time / Time Step = Values 655.35 / 5.12 = 128
Notice that the raw file is either in the directory where the circuit is or its in a separate raw file directory of LTSPICE.
The browser will need some time to load the file and process the data.
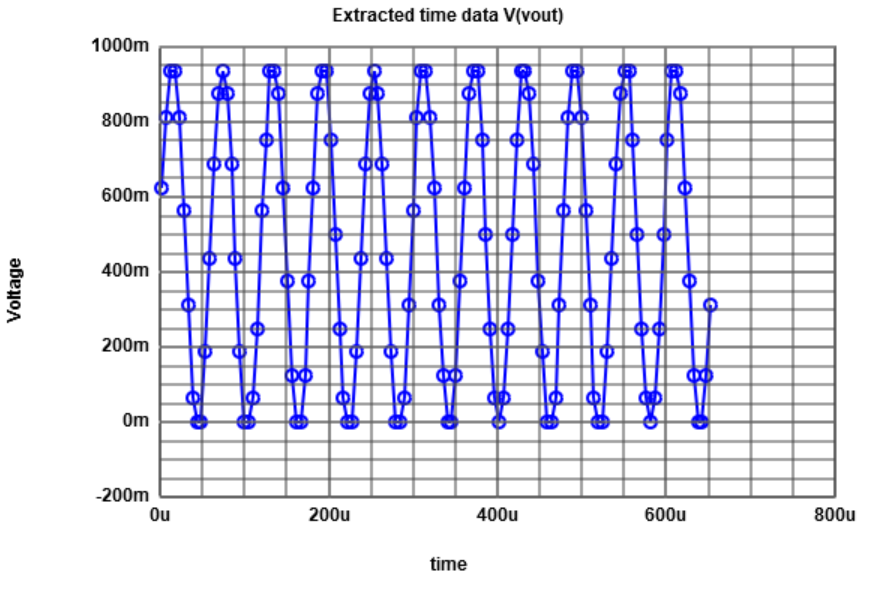
When your browser has loaded all the data you can see the voltage Vout over time.
At "Measurement analysis" we can analize the data.
With the button "Extracted values" you can see the extracted values from the data.
In the table you can see the the Index, the time step and the vout voltage
With the button "Map to integer" you map the extracted values from 0 to the choosen number 15.
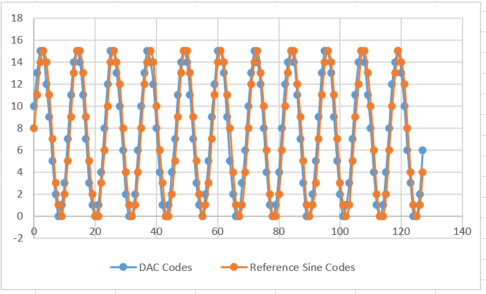
In the table you get the mapped numbers of the sine curve dots. In the second graph you see the mapped values.
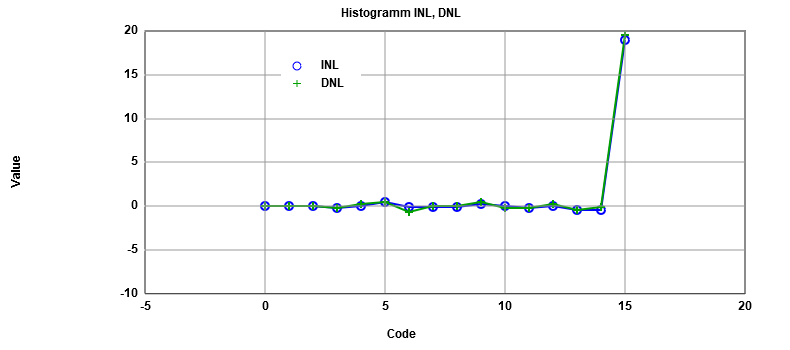
With the button "DAC histogram ramp analysis" you get the INL and DNL of the sine data.
In the table you can see now the code, #occurence, INL and DNL.
Press the "Map to integer" Button to get integer values of the meausred points and copy them with ctrl + C.
Open the link "FFT data processing" in a new tab and insert the copied values at "Input Data".
FFT of sine signal at 4Bit_ADC_DAC_pipe.asc
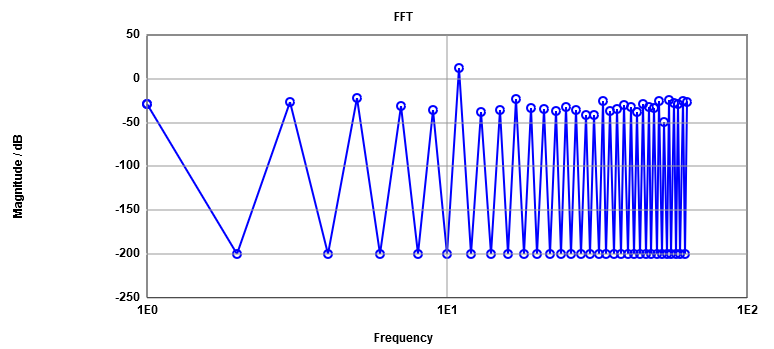
Click on the "Read positive integer data" to calculate the FFT from the integer values.
In the graphs you can see the Time signal of the input data, the FFT and INL, DNL as graphs.
In the "Signal to Noise" table you can see the freuqency, the singal mangnitude in dB and total noise magnetude in dB.
The difference between the 11.87 dB signal magnitude and -13.89 dB noise magnitude is arround 24 dB.
24 dB devided through 6 dB is N = 4 -> 4Bit according to the SNR 20 * N * log(2) = 6.02 * N db
Analyse the data with 4 bits - put in 4 at "Number of Bits"
Generate the plots again through pressing the "Generate Charts ..." button.
Now you get the real INL and DNL of the FFT.
What we also can see is, that in the FFT analysis the INL and DNL at the last point is sticks out.
This is not normal so we have to think about, if this Java-Script is saying the truht.
Let's check this in Excel.
Analysing the INL and DNL of the sine signal in Excel
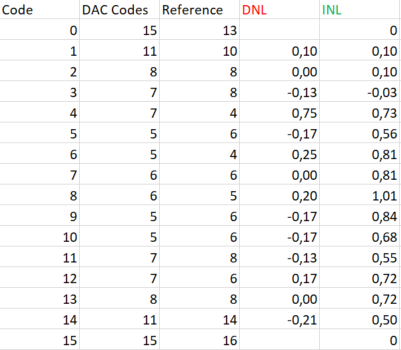
Follow the mentioned steps to create a excel-file with INL and DNL of the FFT-signal.
Insert the copied integer values of the simulated "Read Raw File" into the program Microsoft Excel
into a empty table column "B".
Column "A" gets filled with increaseing indexes starting at 0 to 127.
Generate a reference sine wave with the following formula into column "C":
=RUNDEN(7,5+7,5*SIN(2*PI()*11*A2/128);0)
With a function called "Privot Table" Excel gives you the occurence of the insertet
DAC codes and the reference sine curve.
Now we only work with the results of the two privot tables.
We calculate the DNL subtracting the reference values from measured values devided throught the
reference values.
The INL is calculated through the summation of the DNL.
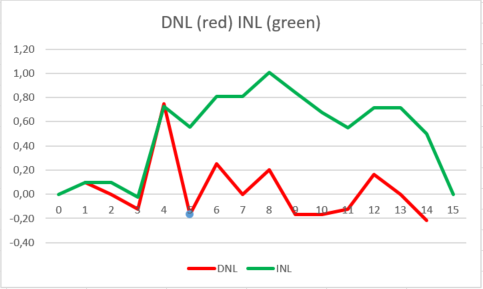
With the results of the DNL and INL we can plot this in a graph and compare it to the results of
of the javascript.
We can see, that this last point on the webpage plot with the javascript - is not like in the
hand calculation in excel.
So we've been right, that there is something wrong on the calculations of the webpage.