Building a 8 bit DAC
|
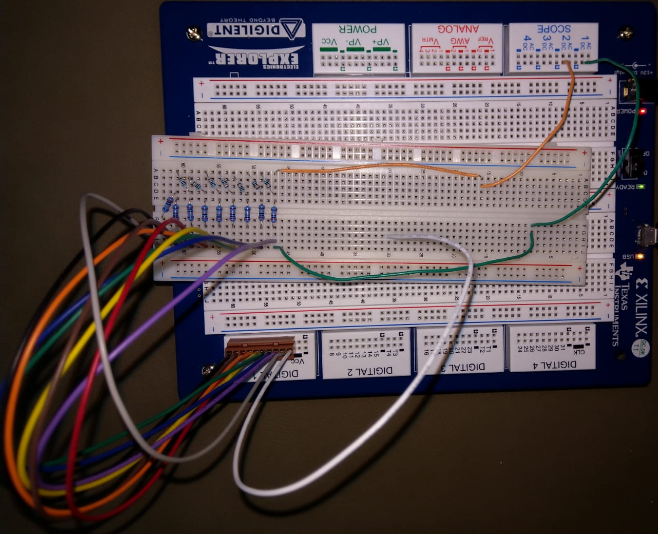 figure 1
| schamatic 1 |
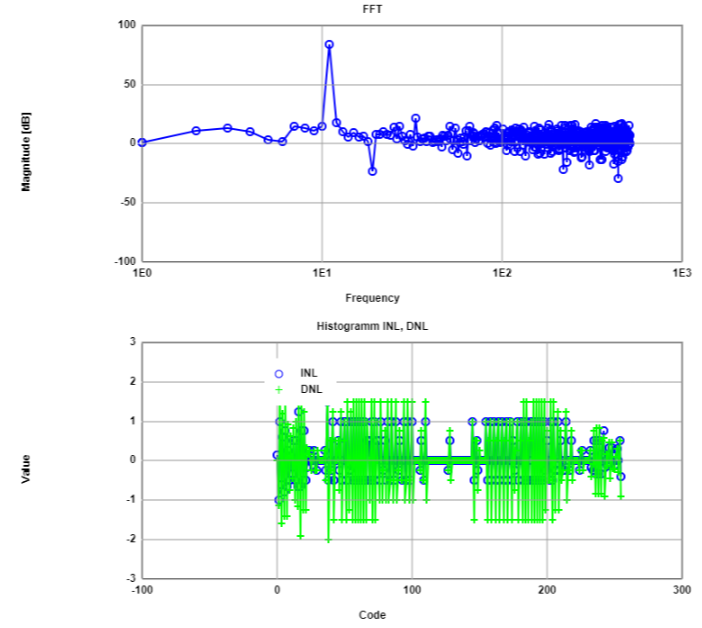
Simulation of DAC with ramp test
|
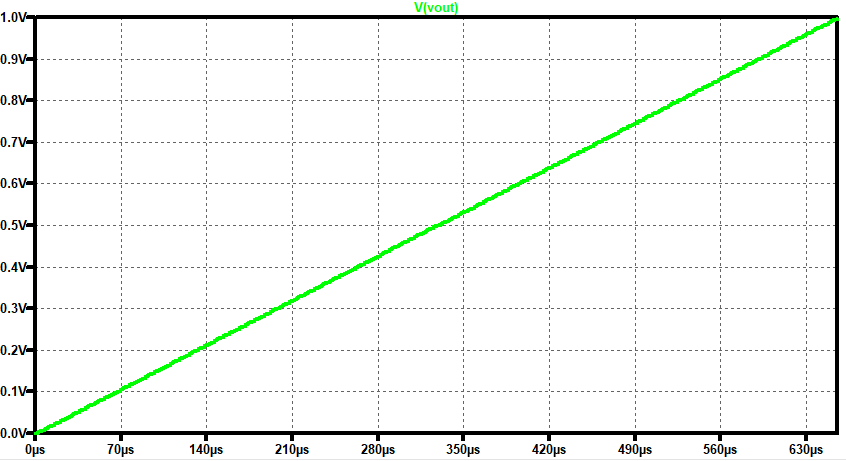 figure 1
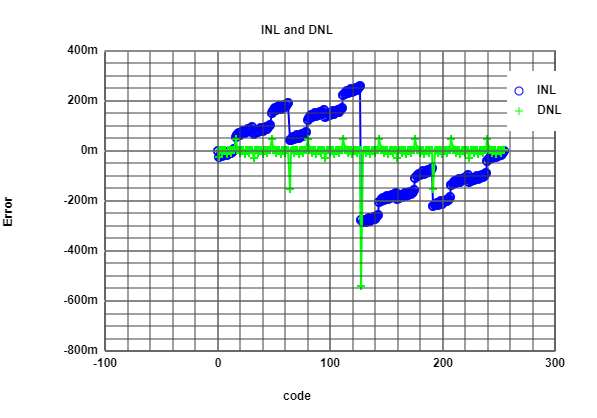 figure 2
|
|
figure 1
| schamatic 1 |
|
figure 1
figure 2
|
|
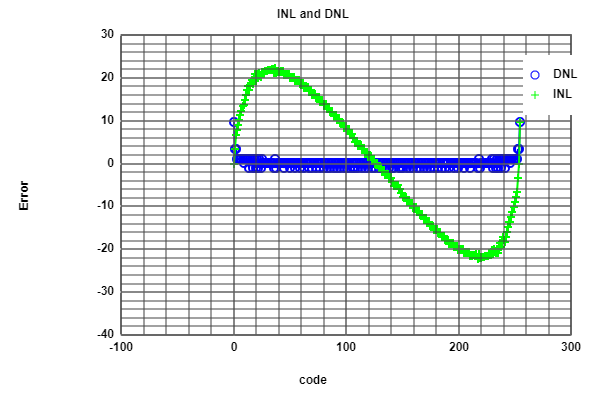 figure 1
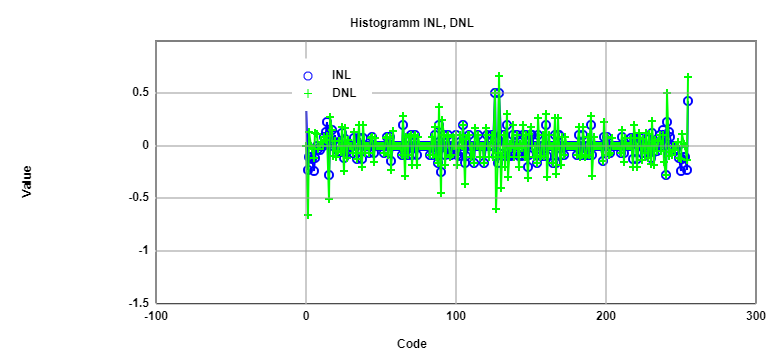 figure 2
|
 figure 3
 table 1
|
|
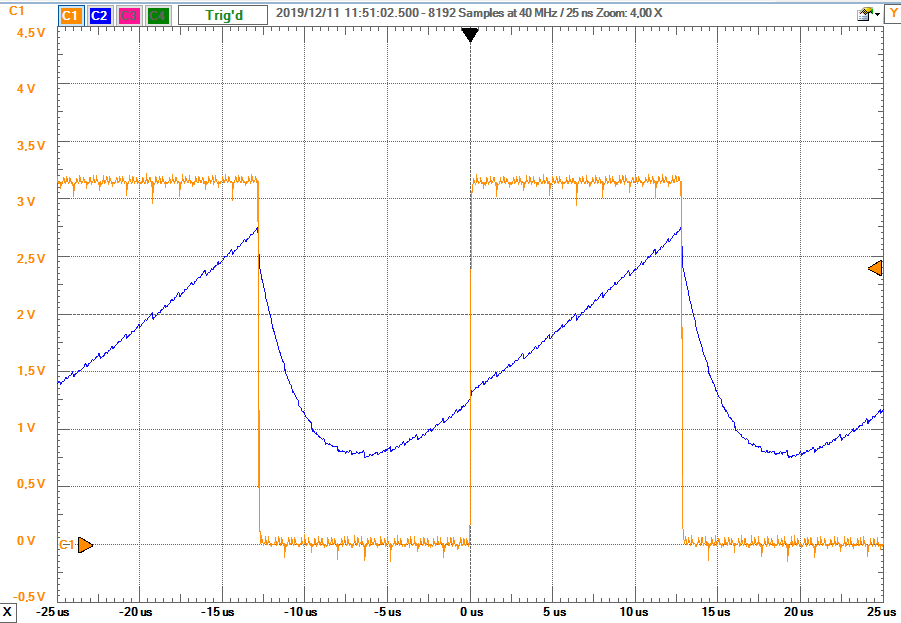 figure 1
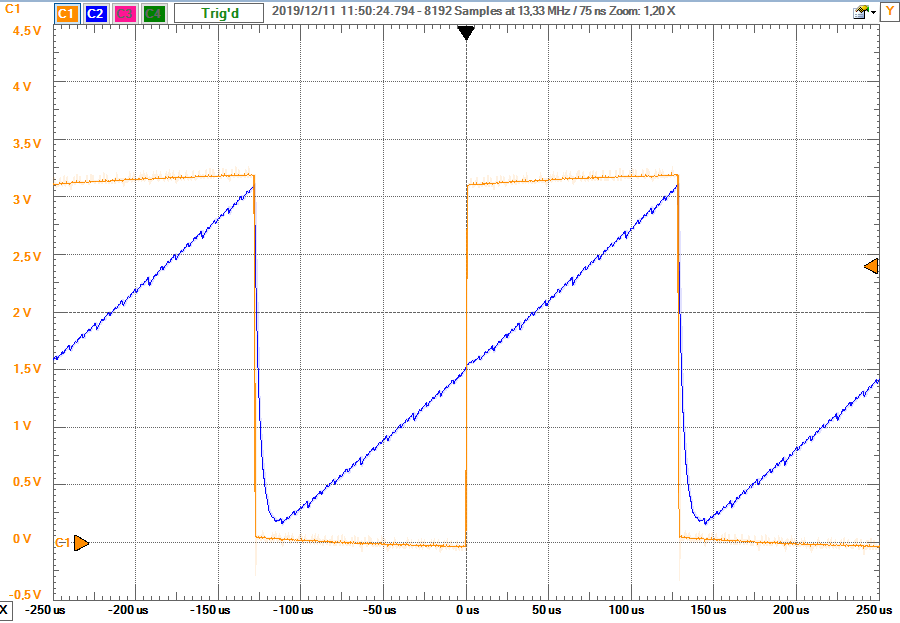 figure 2
|
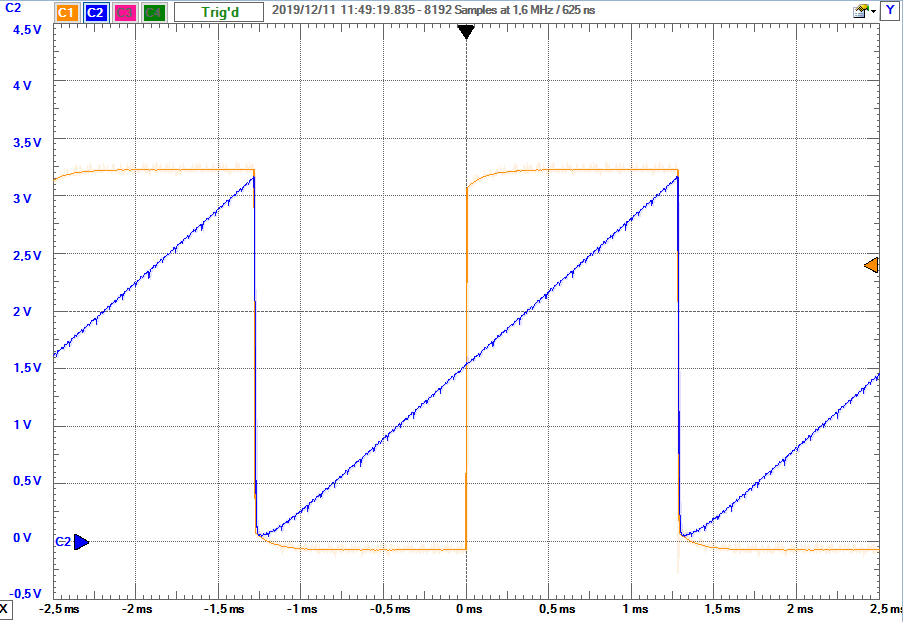 figure 3
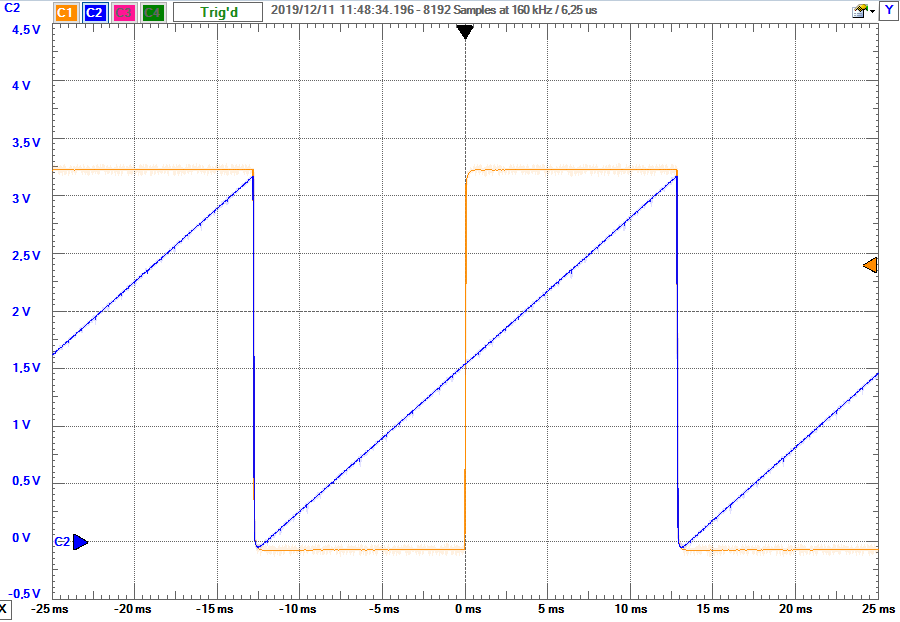 figure 4
|
|
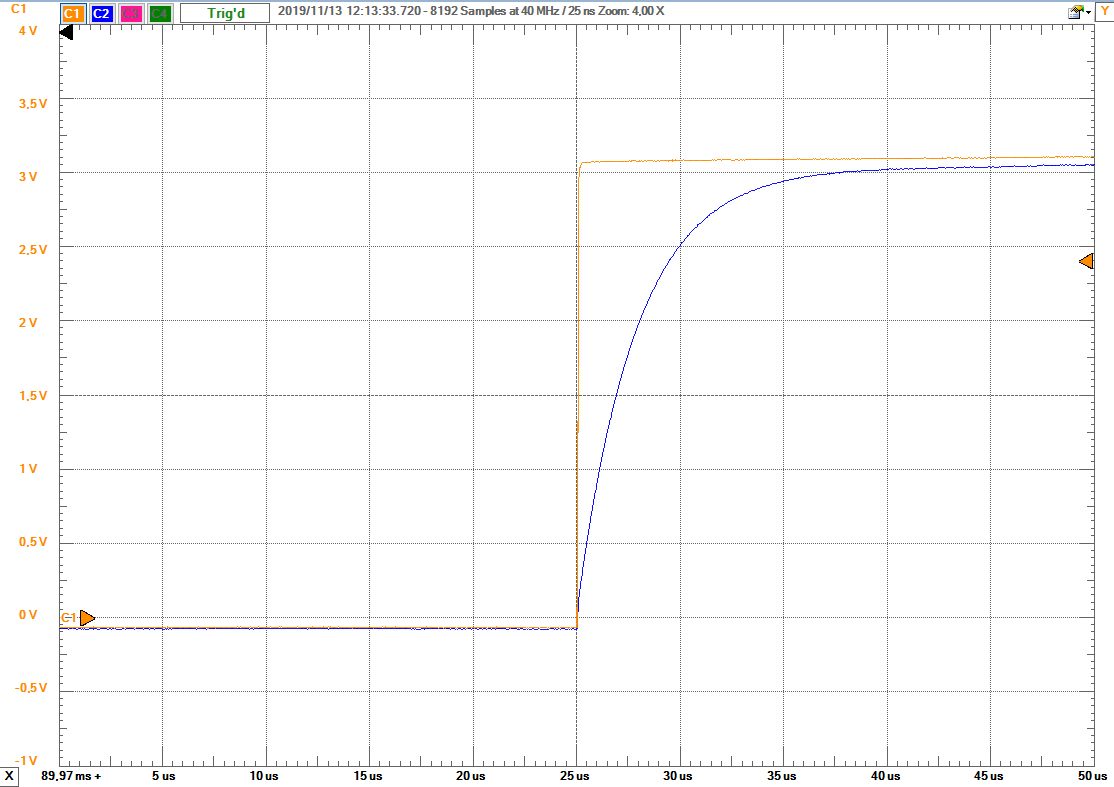 figure 1
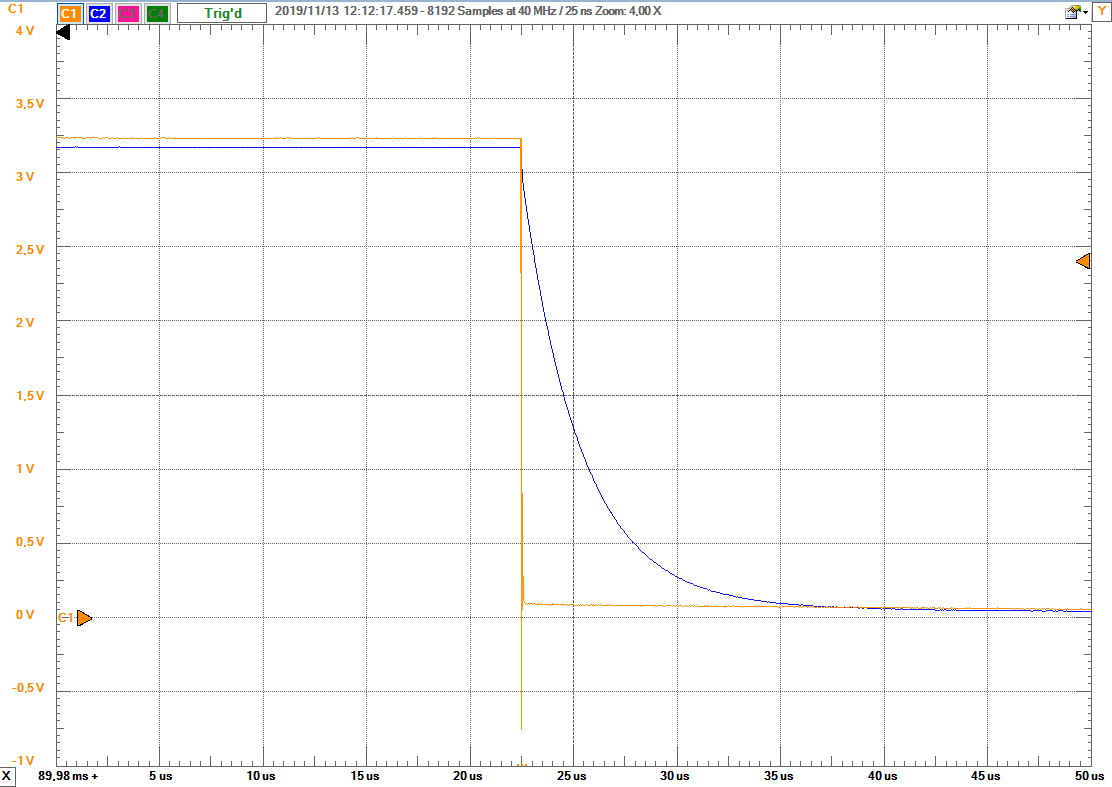 figure 2
|
|
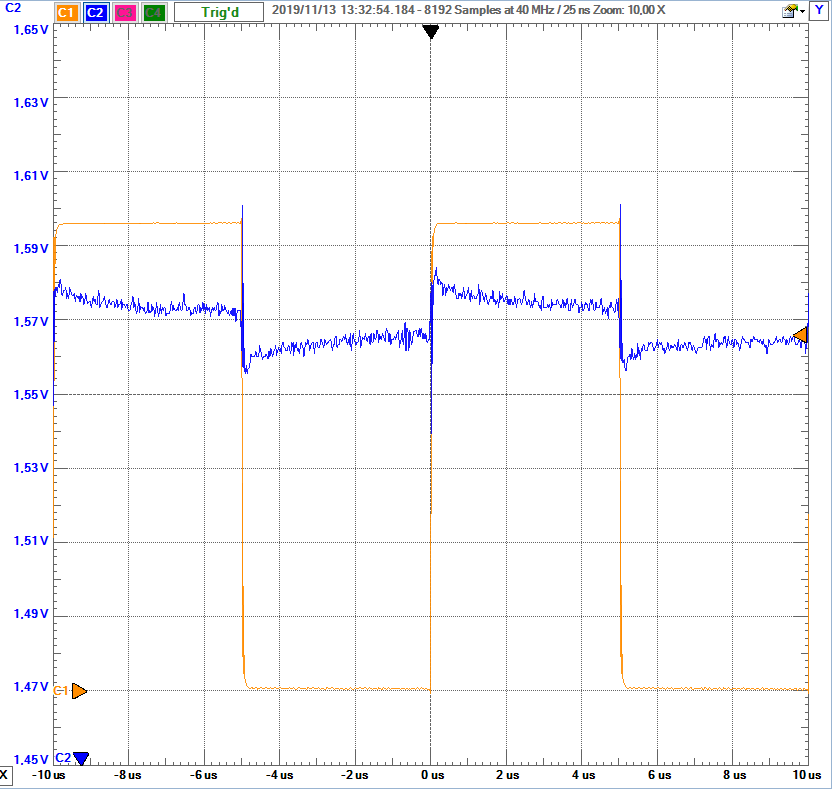 figure 1
|
|
 figure 1
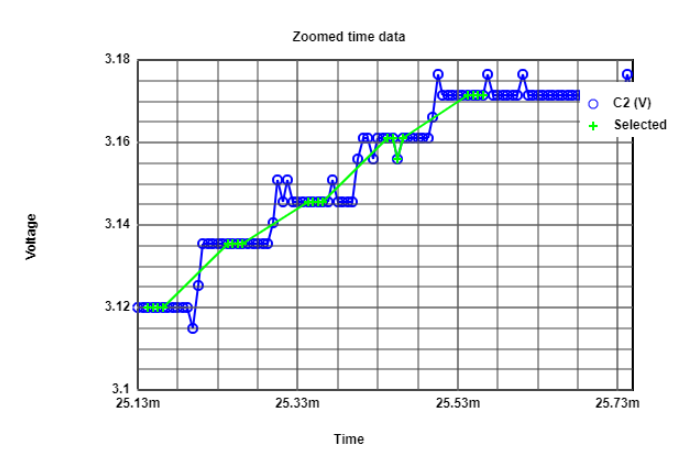 figure 2
|
|
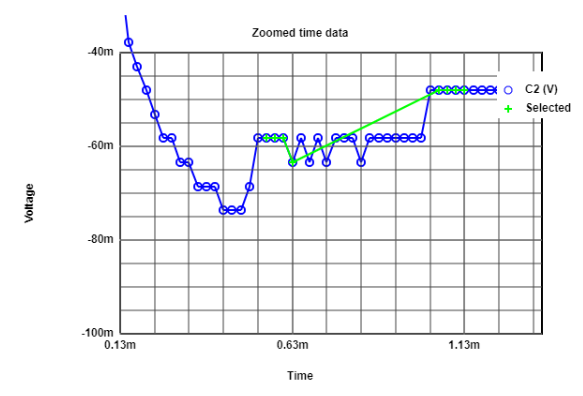 figure 1
|
|
|
|
|
|
|
|
|
|
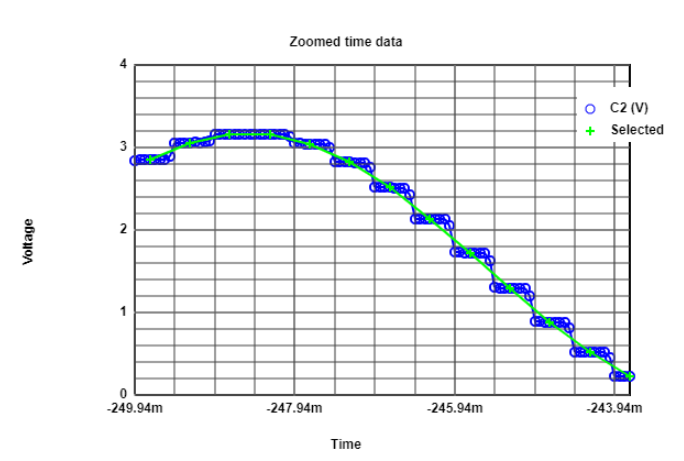
we need a certain input pattern. Available here stairs at diffrent periods |
|
|
|
|
|
|
|
|
|
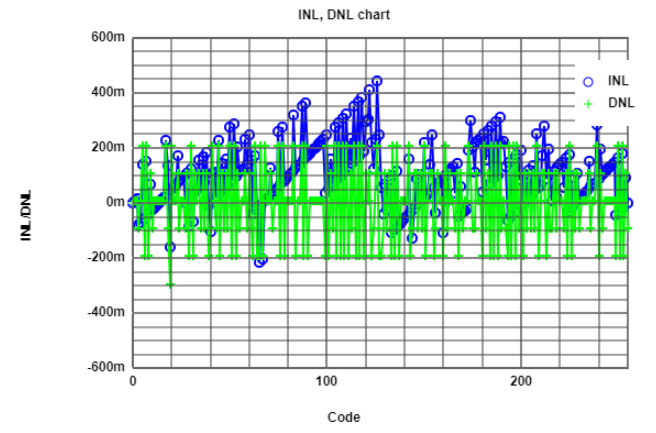 figure 1
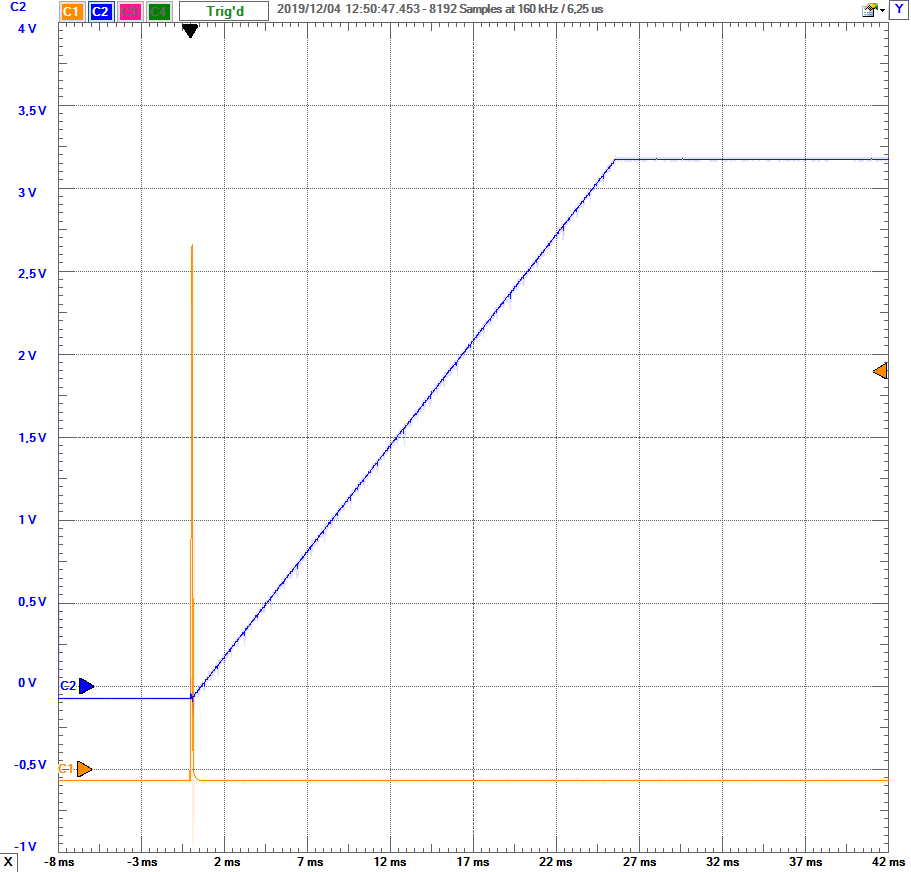 figure 2
|
|
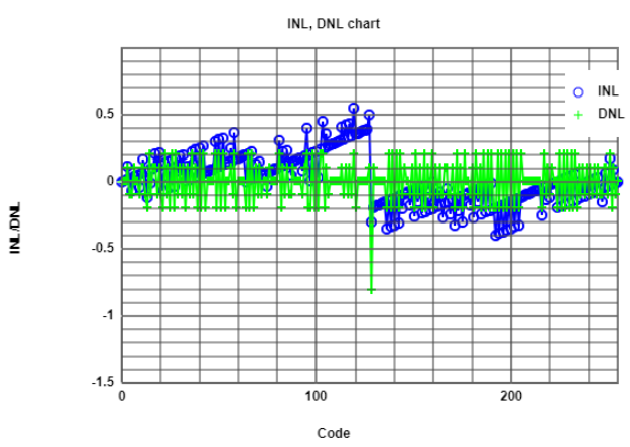
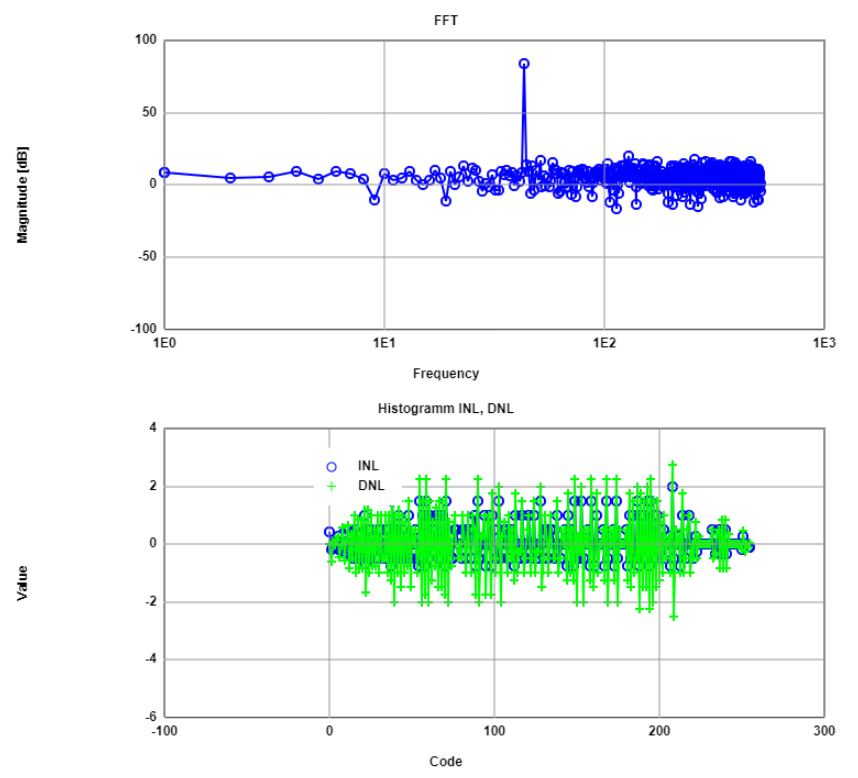
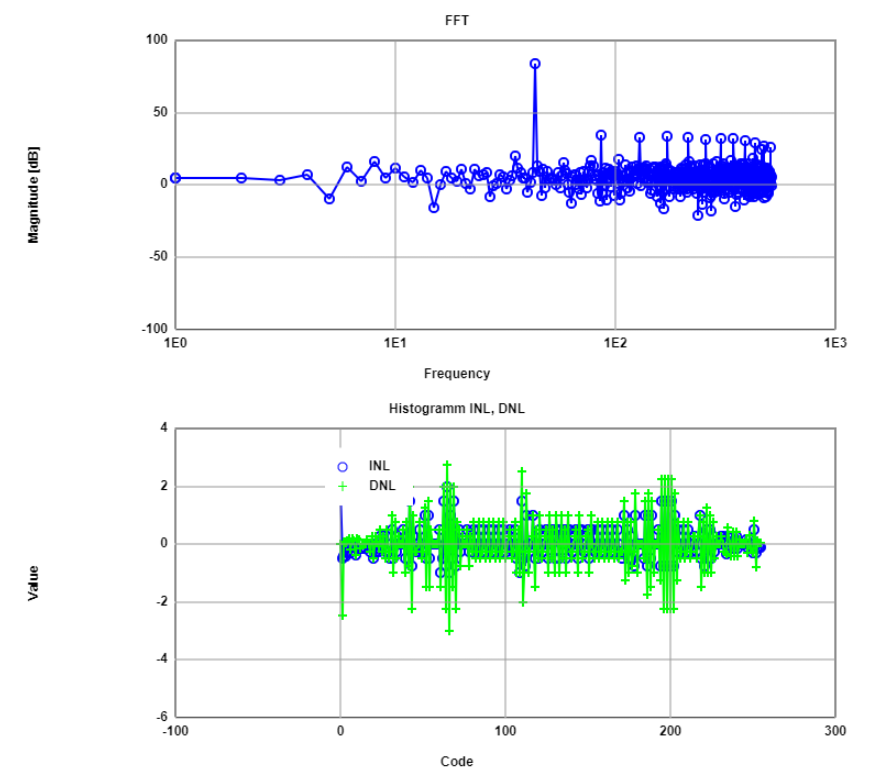
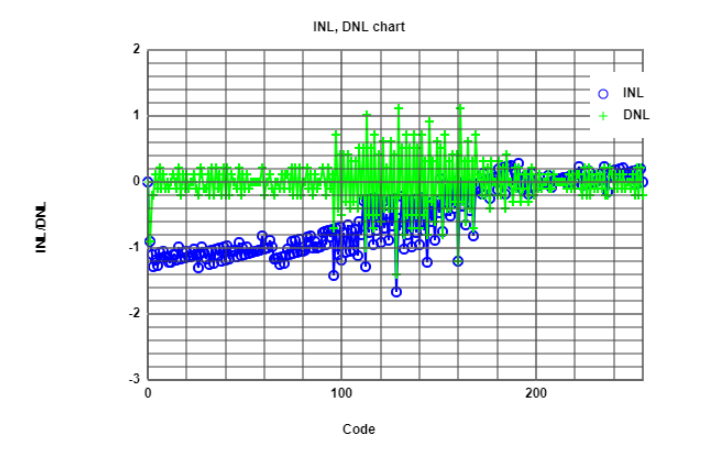
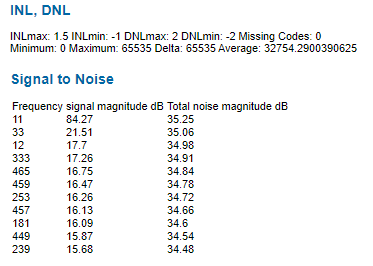
despite our uncalibrated ramp wasn't so bad and the large DNL at zero is caused by calibration (not wrong data selection) |
|
|
|
|
|
|
|