Simulation and analysis of a ramp signal for the ADC DAC
To create the data for the analysis, the provided ADC DAC template was used for the LTSPICE simulation.The ramp signal was implemented via a pulse voltage and afterwards the simulation was carried out.
The following values were used for the pulse voltage:
Vinital = 0V; Von = 1V; Tdelay = 0s; Trise = 655.36µs; Tfall = 655.36µs; Ton = 0s; Tperiod = 1310.72µs
The results of the simulation can be seen in the following graph.
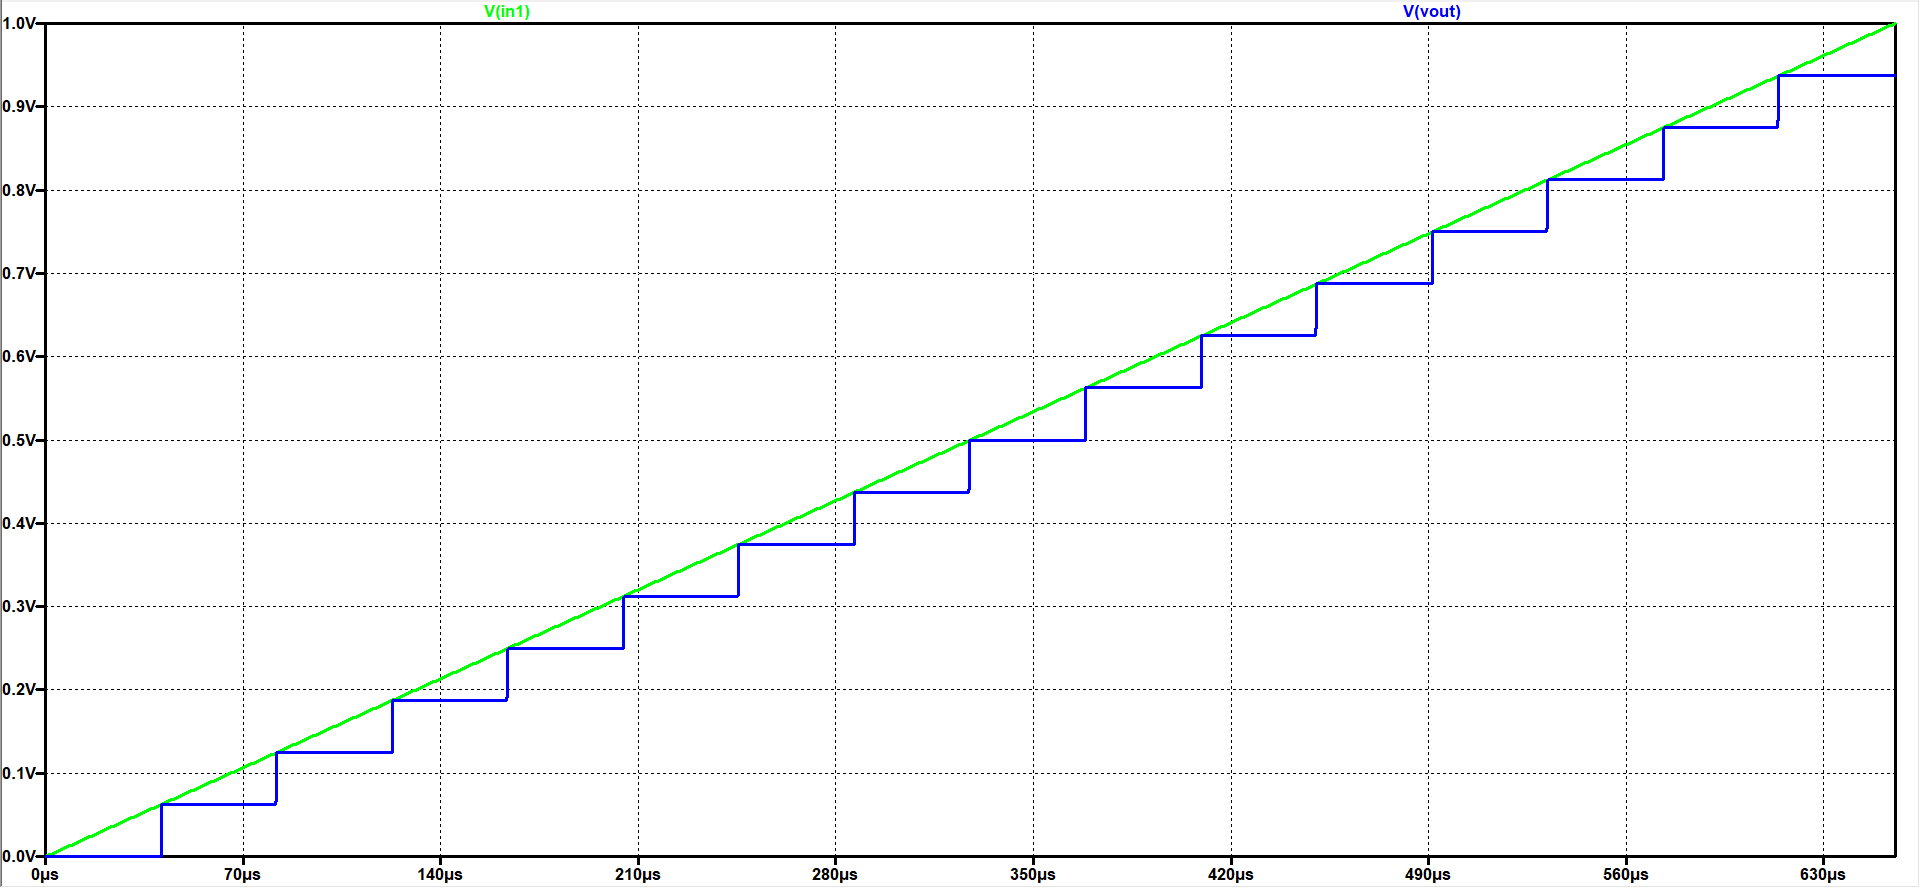
By using this simulation results, the INL and DNL can be calculated with the 'Read-Raw-File tool.
In order to get responsible results the value for the 'Start time' must be 0s, the 'Stop value' must be 655.36µs and the 'Time step' must be 40.96µs. After the raw data was uploaded, the voltage scale value must be adjusted to 15 and then map it to integer.
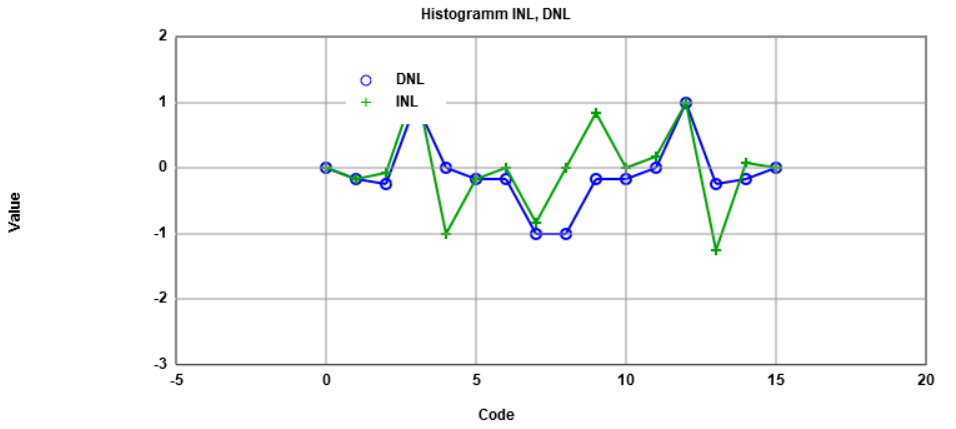
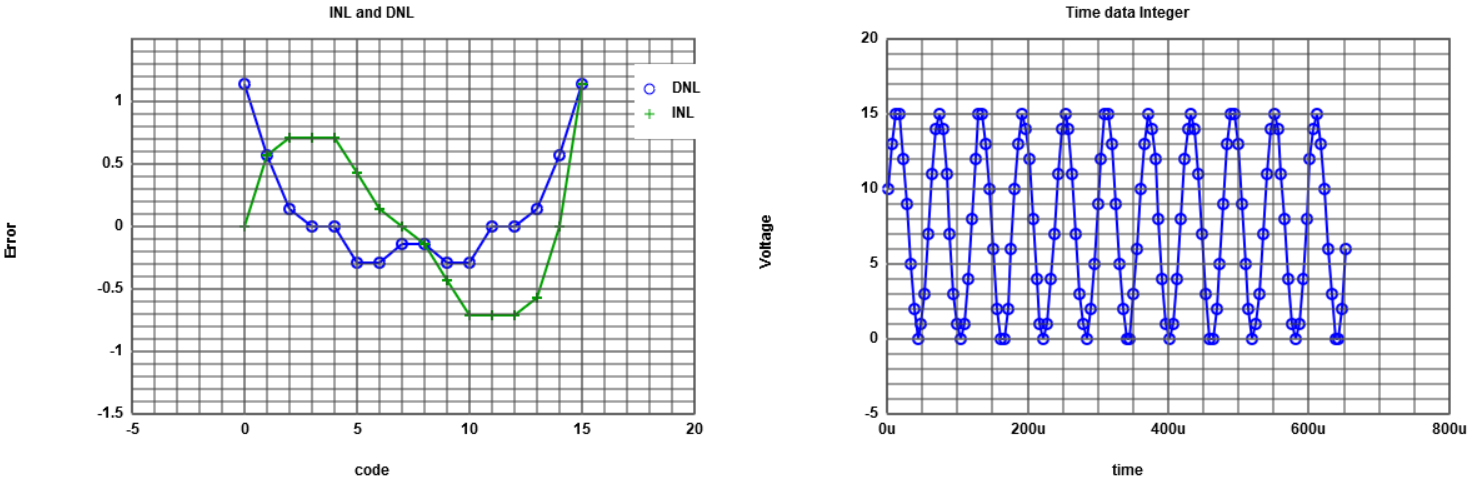
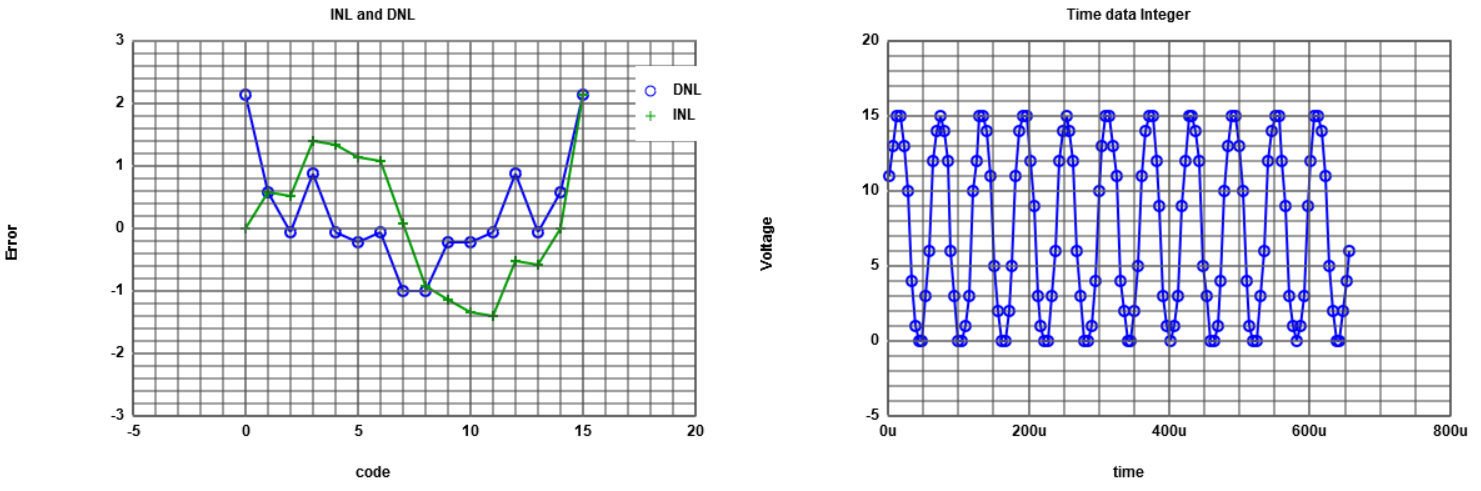
By pressing the 'DAC INL, DNL analysis' button the following results can be seen:
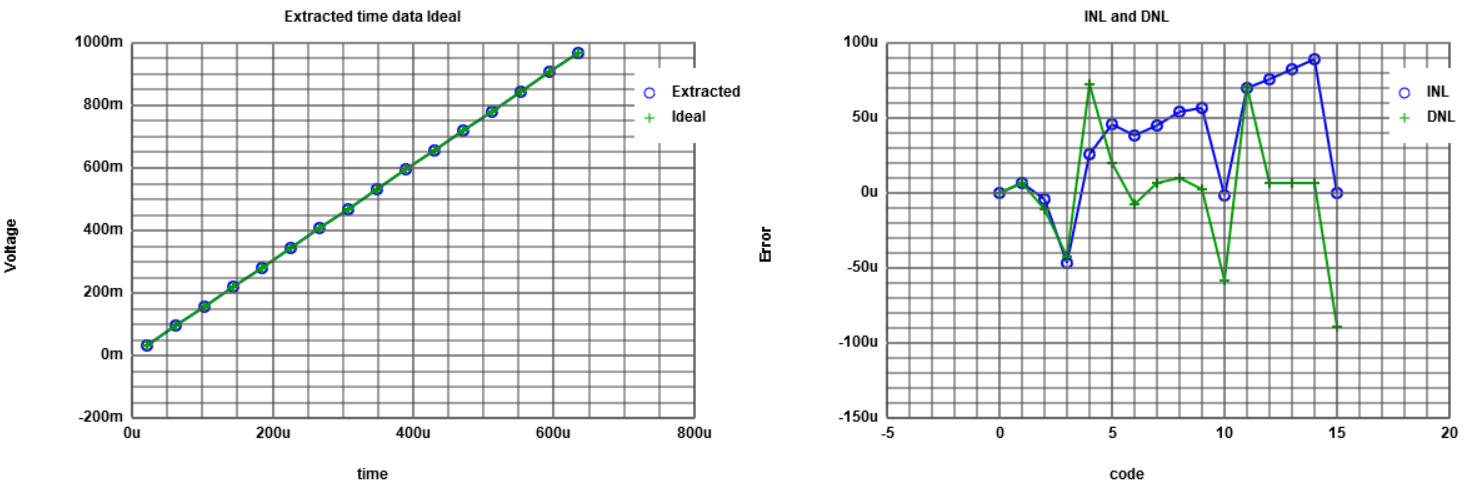
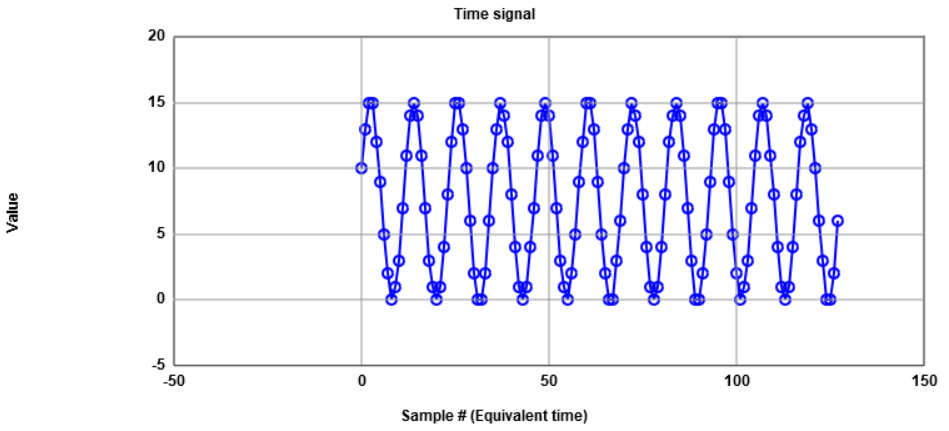
For visualising the step size, the 'Time step' must be changed to 5.12µs.
The following results occur by clicking on the 'ADC histogram ramp analysis' button.
Simulation and analysis of a sinusoidal signal for the ADC DAC
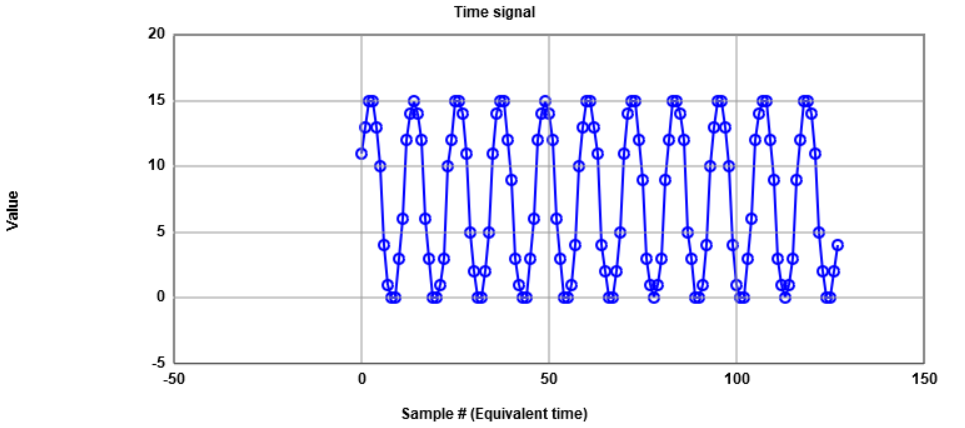
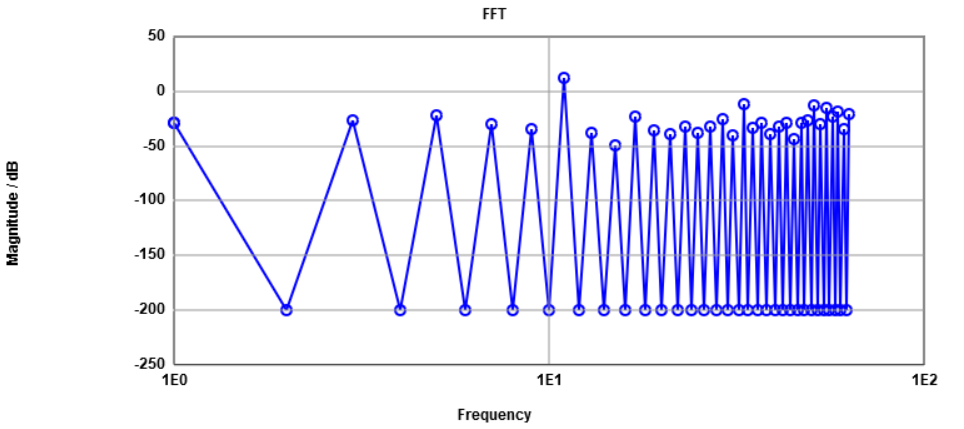
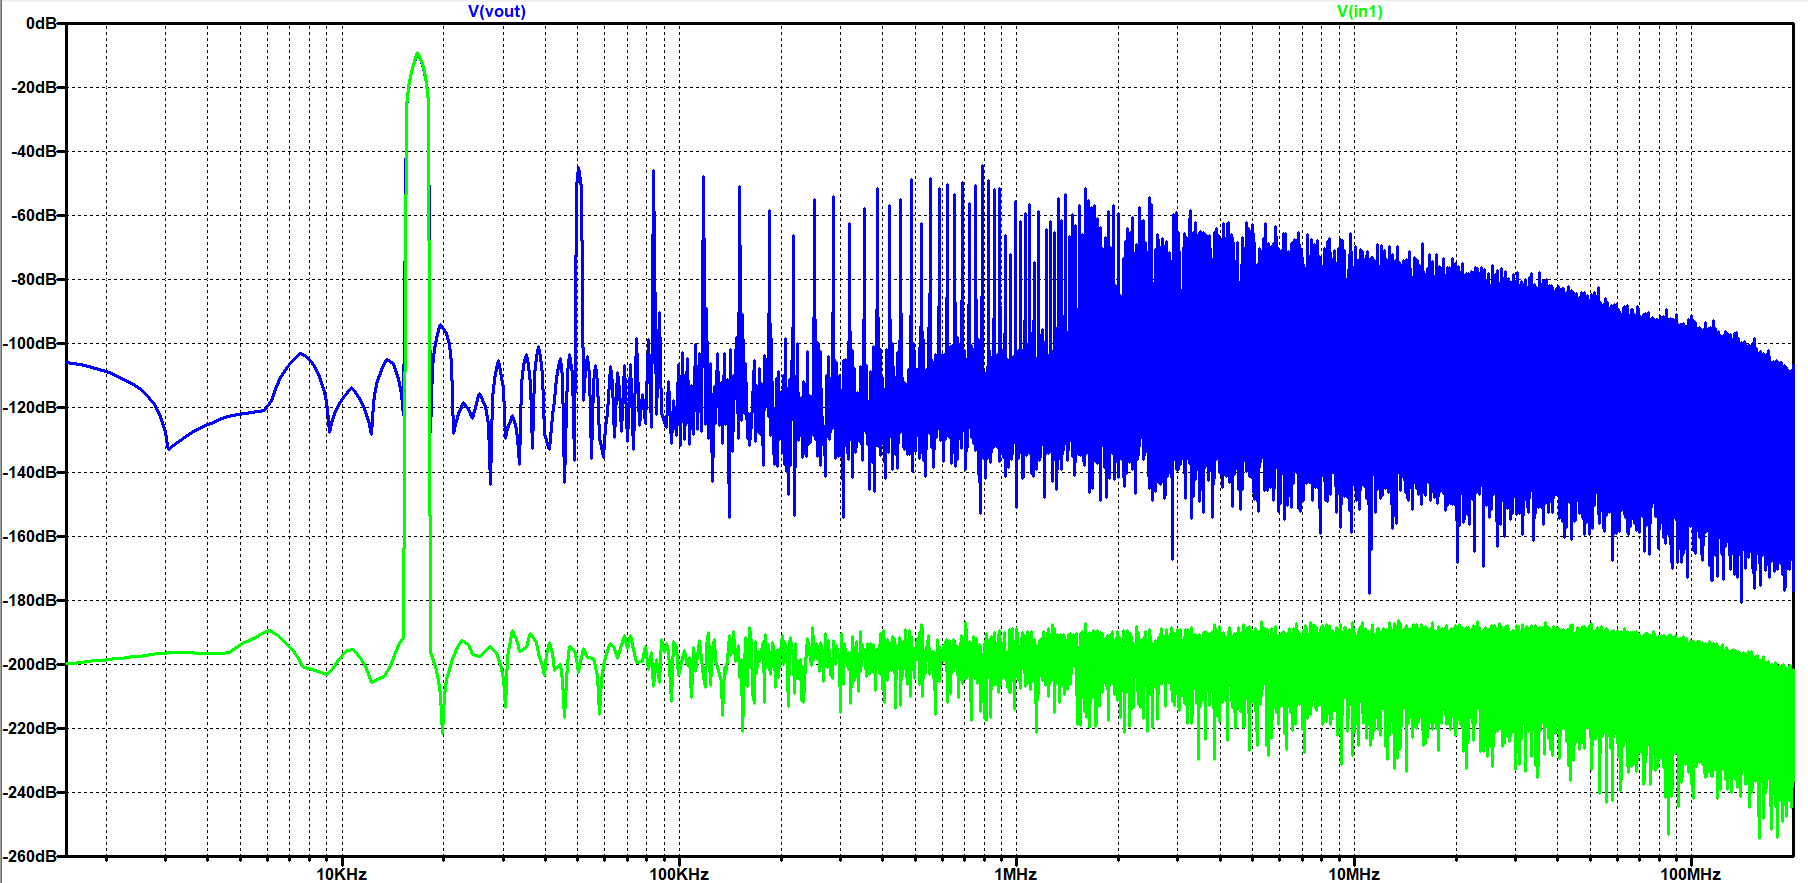
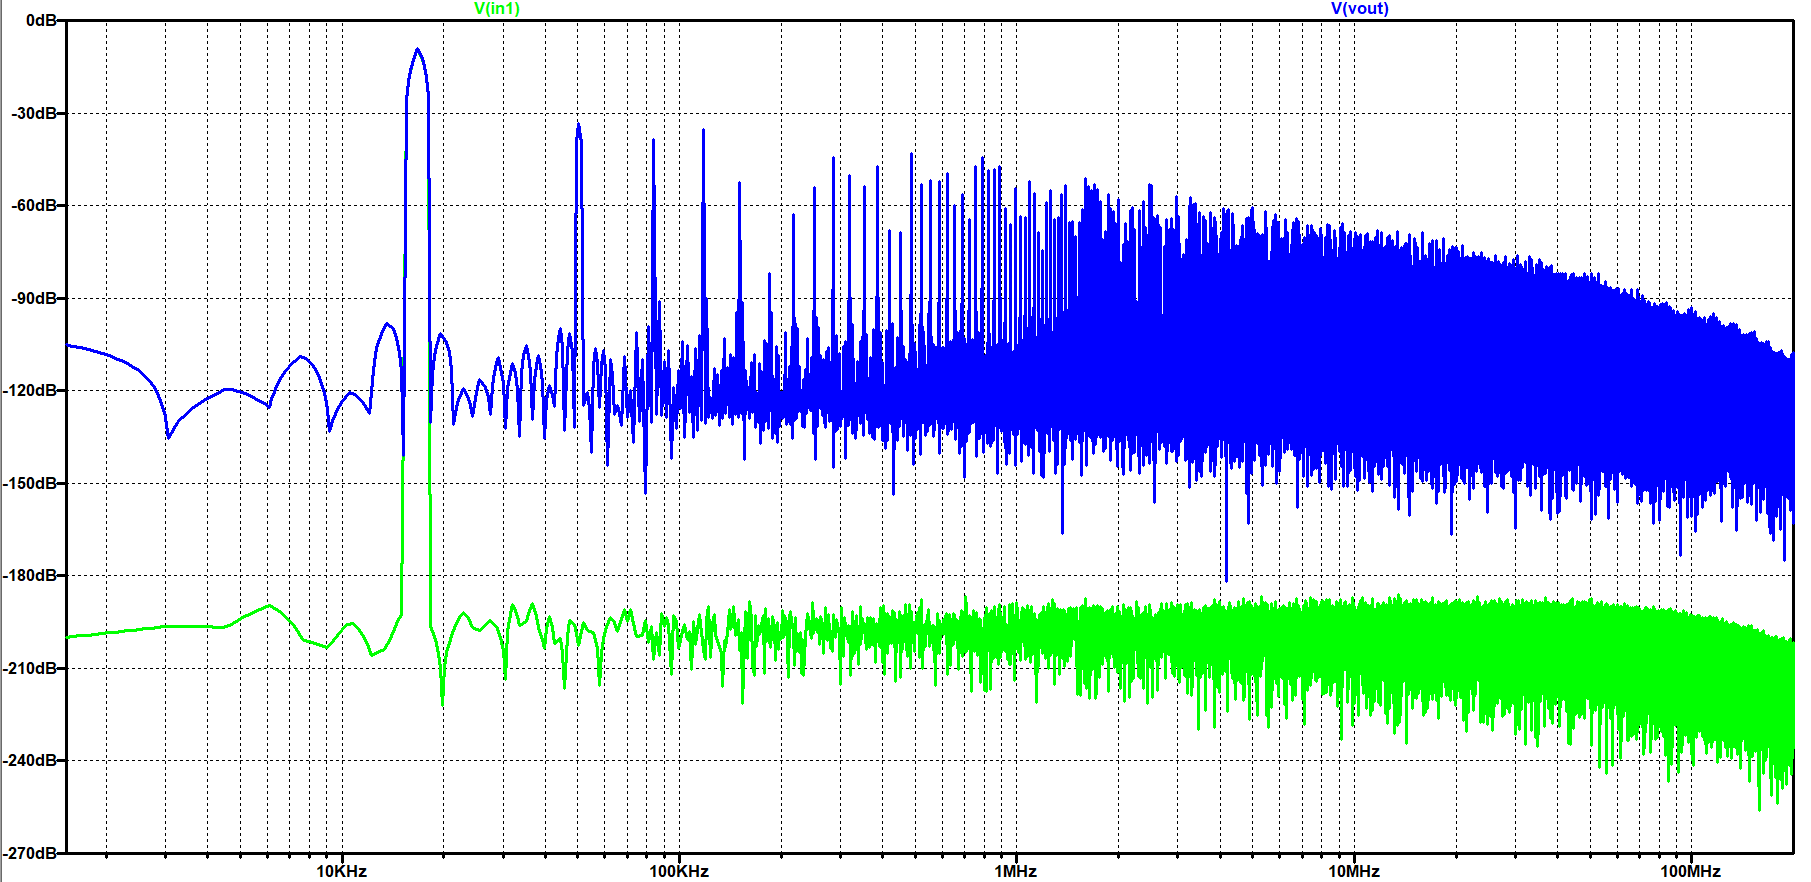
Using the given template, a sinusoidal signal as an input signal was simulated in LTSpice.Afterwards the FFT function of LTSpice was used and the following graph is the result.
In order to get a correct result graph the number of data points for the FFT must be changed to 65536.
In the FFT-graph the input signal is green and the output is blue.
The biggest peak of the input/output is the frequency of the sinusoidal signal and is approximately 0dB.
Since the output curve has a higher noise, even though of a good SNR, this will lead to a worse signal quality.
After the simulation was done, the 'Read-Raw-File-Tool' was used for a further analysis of the data.
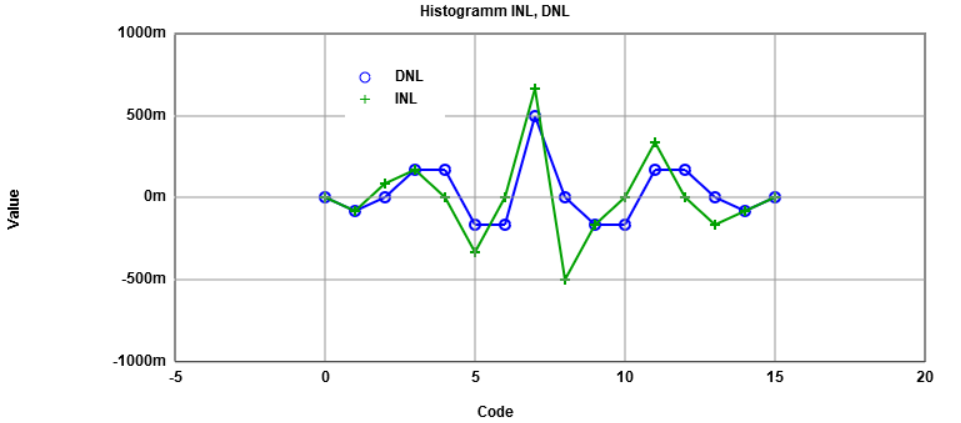
Using this tool the following graph is the result for the histogram test.
Besides there is also a tool for a FFT analysis. The input values for this tool are the mapped integer values of the 'Read-Raw-File-Tool'.
If these values were read in and the number of bits was changed to 4, the tool generates following charts:
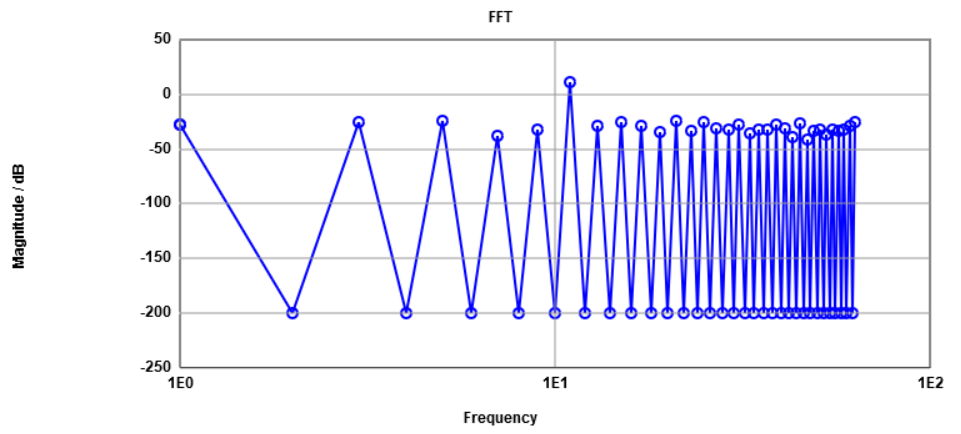
The FFT analysis shows the real INL and DNL error since the tool comparing the simulated sinusoidal signal with an ideal one.
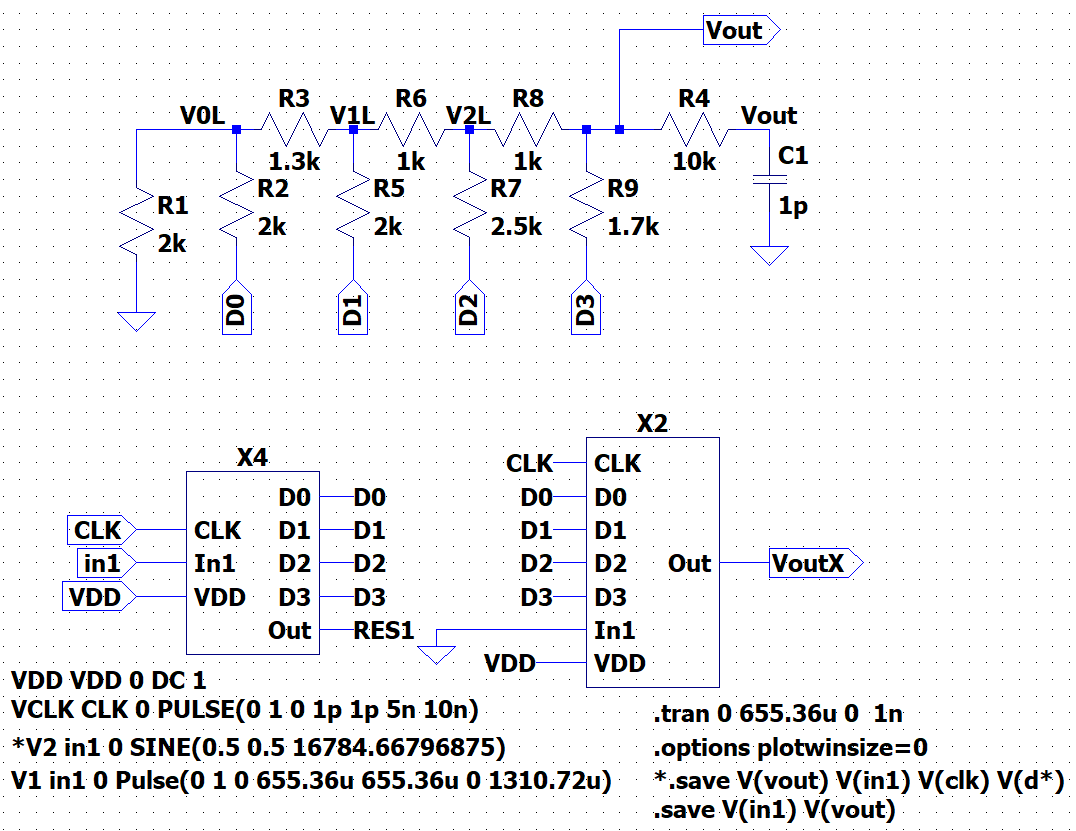
Simulation and analysis of a ramp signal for the ADC R2R-DAC
First the R2R-DAC was copied into the 4Bit_ADC_DAC_pipe.asc file.Afterwards some of the resistance values was changed in order to get a non-ideal R2R-DAC.
These resistance changes can be seen in the following schematic, where the resistances R7 (second most significant bit) and R9 (most significant bit) was changed from 2kΩ to 2.5kΩ respectively 1.7kΩ.
The resistance R3 is also changed in fact from 1kΩ to 1.3kΩ.
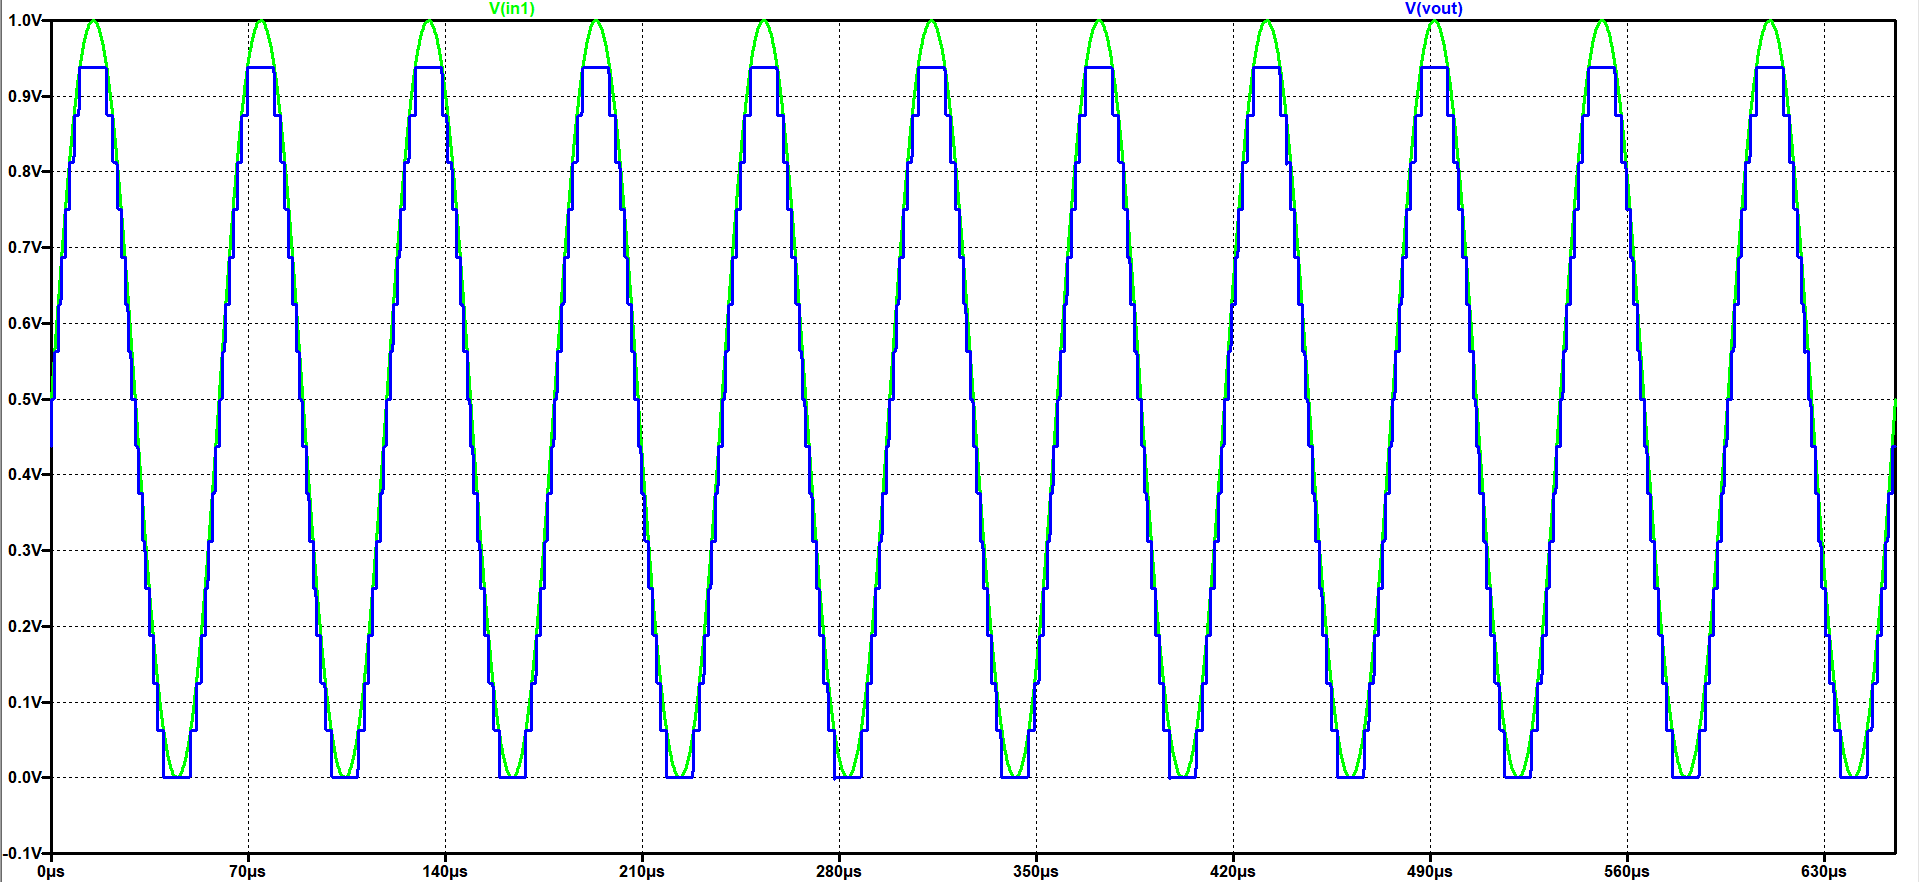
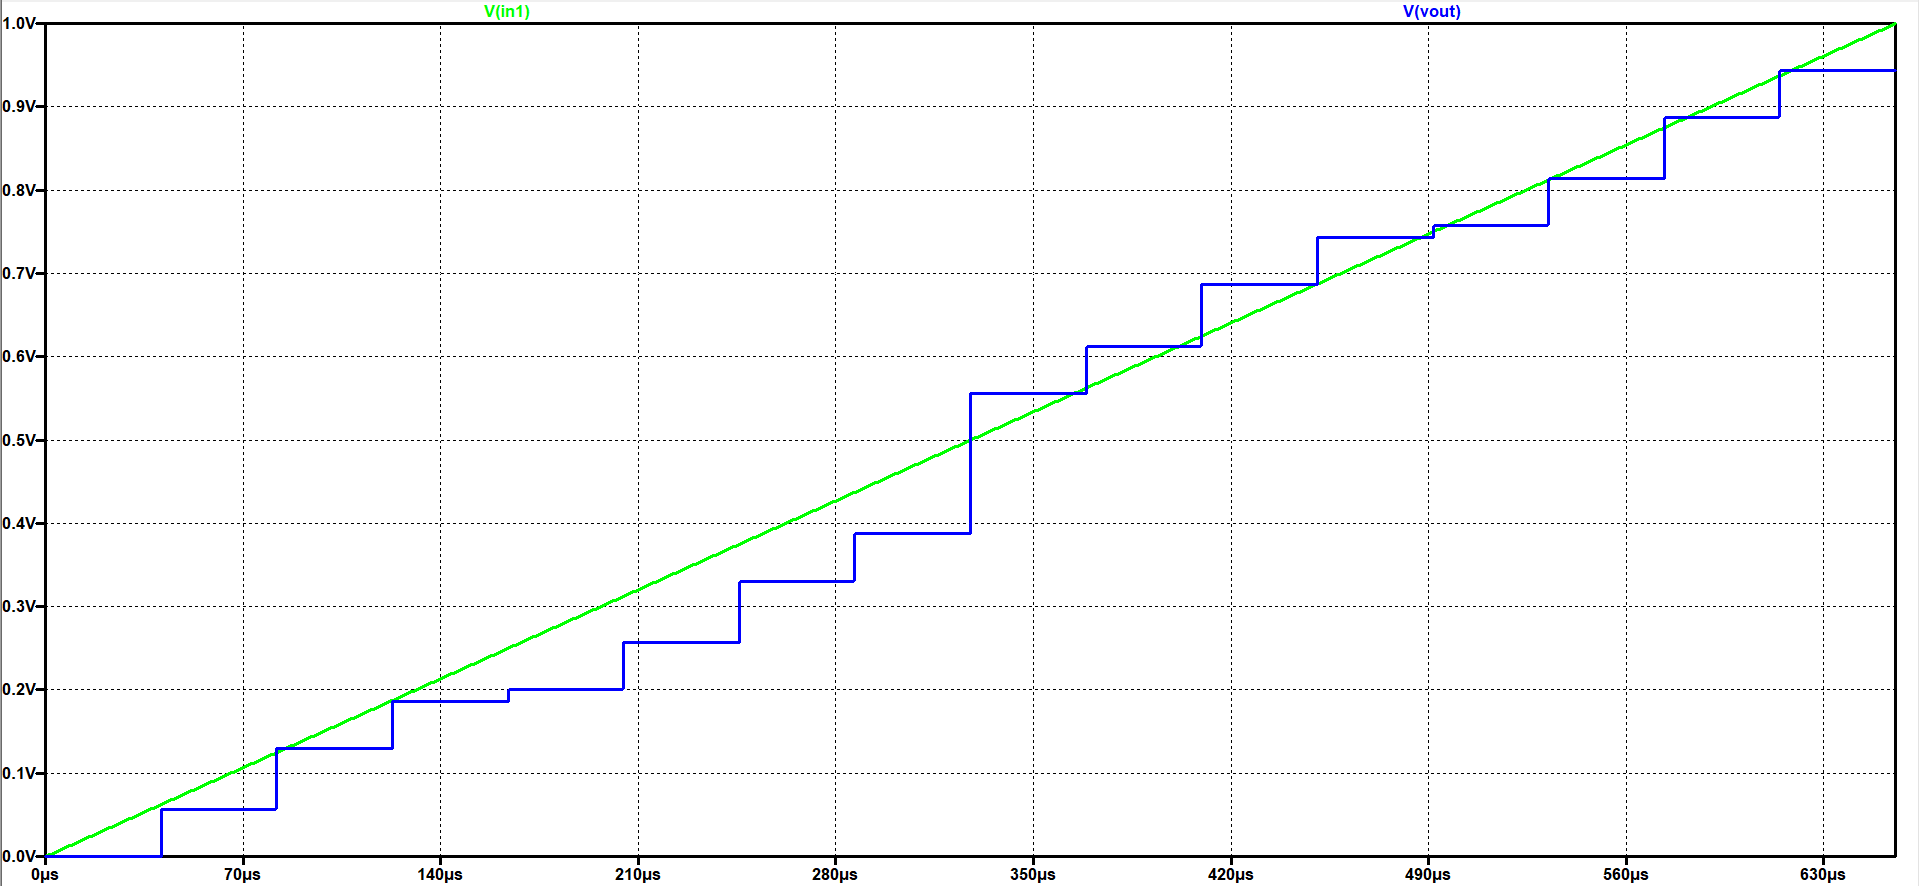
In the following output curve it can be seen that now the result is a non-ideal stepsize output.
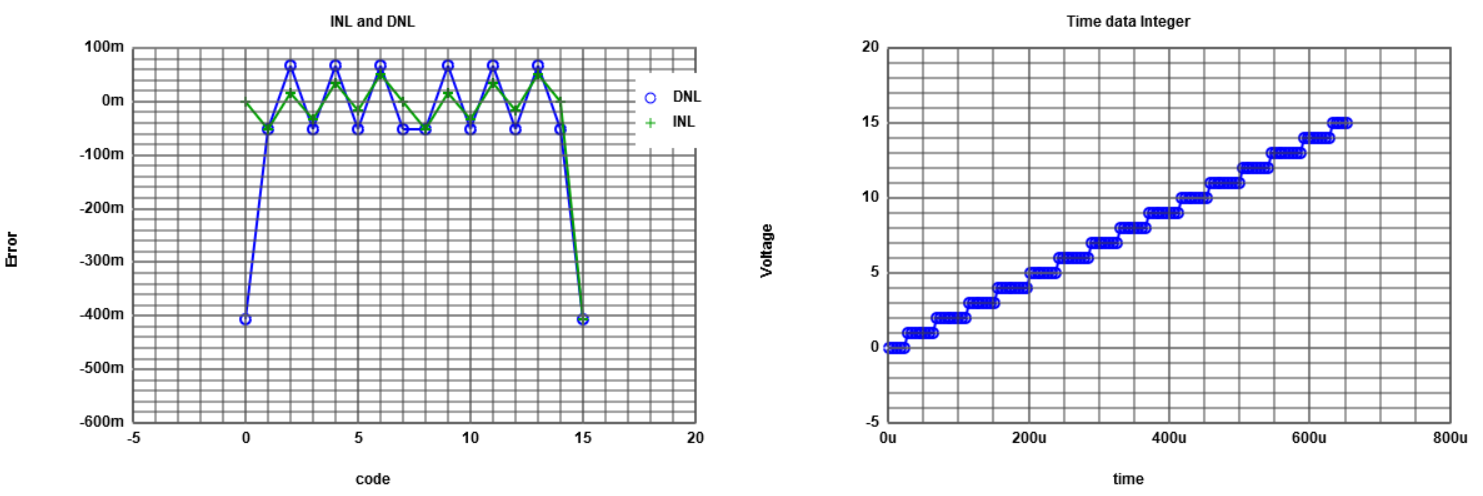
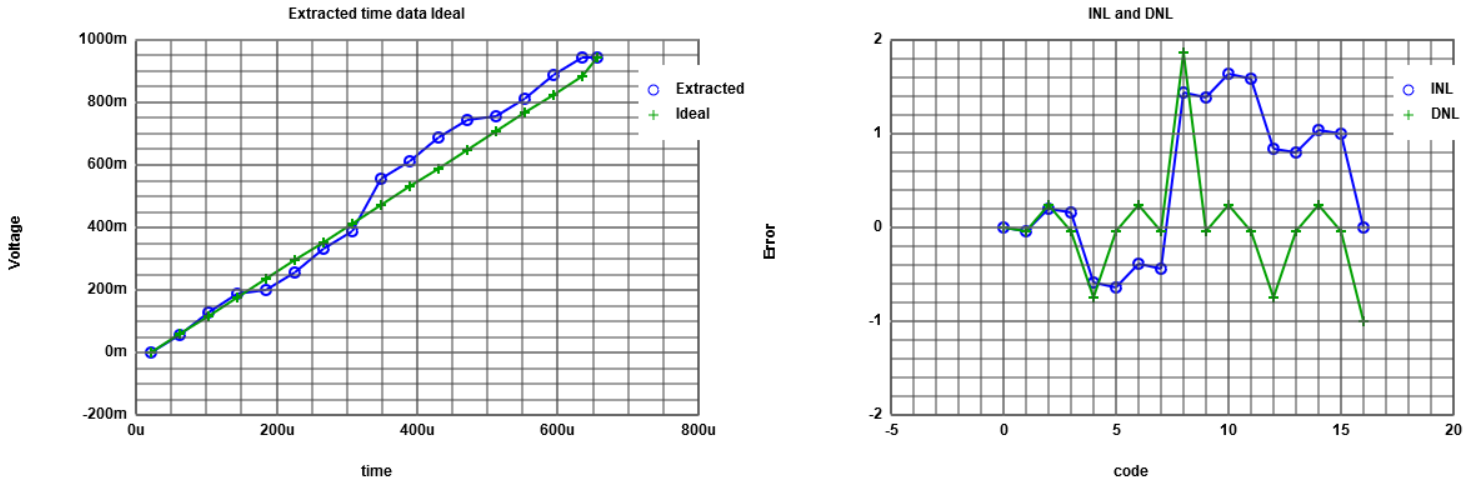
So again the INL and DNL was analysed with the 'Read-Raw-File-Tool with the same values as already disscussed but now with the new raw data.
As it can be seen in the following chart, the INL and DNL are much bigger especially for the code 8(1000).
This matches the big deviation of an ideal stepsize in the previous diagram.
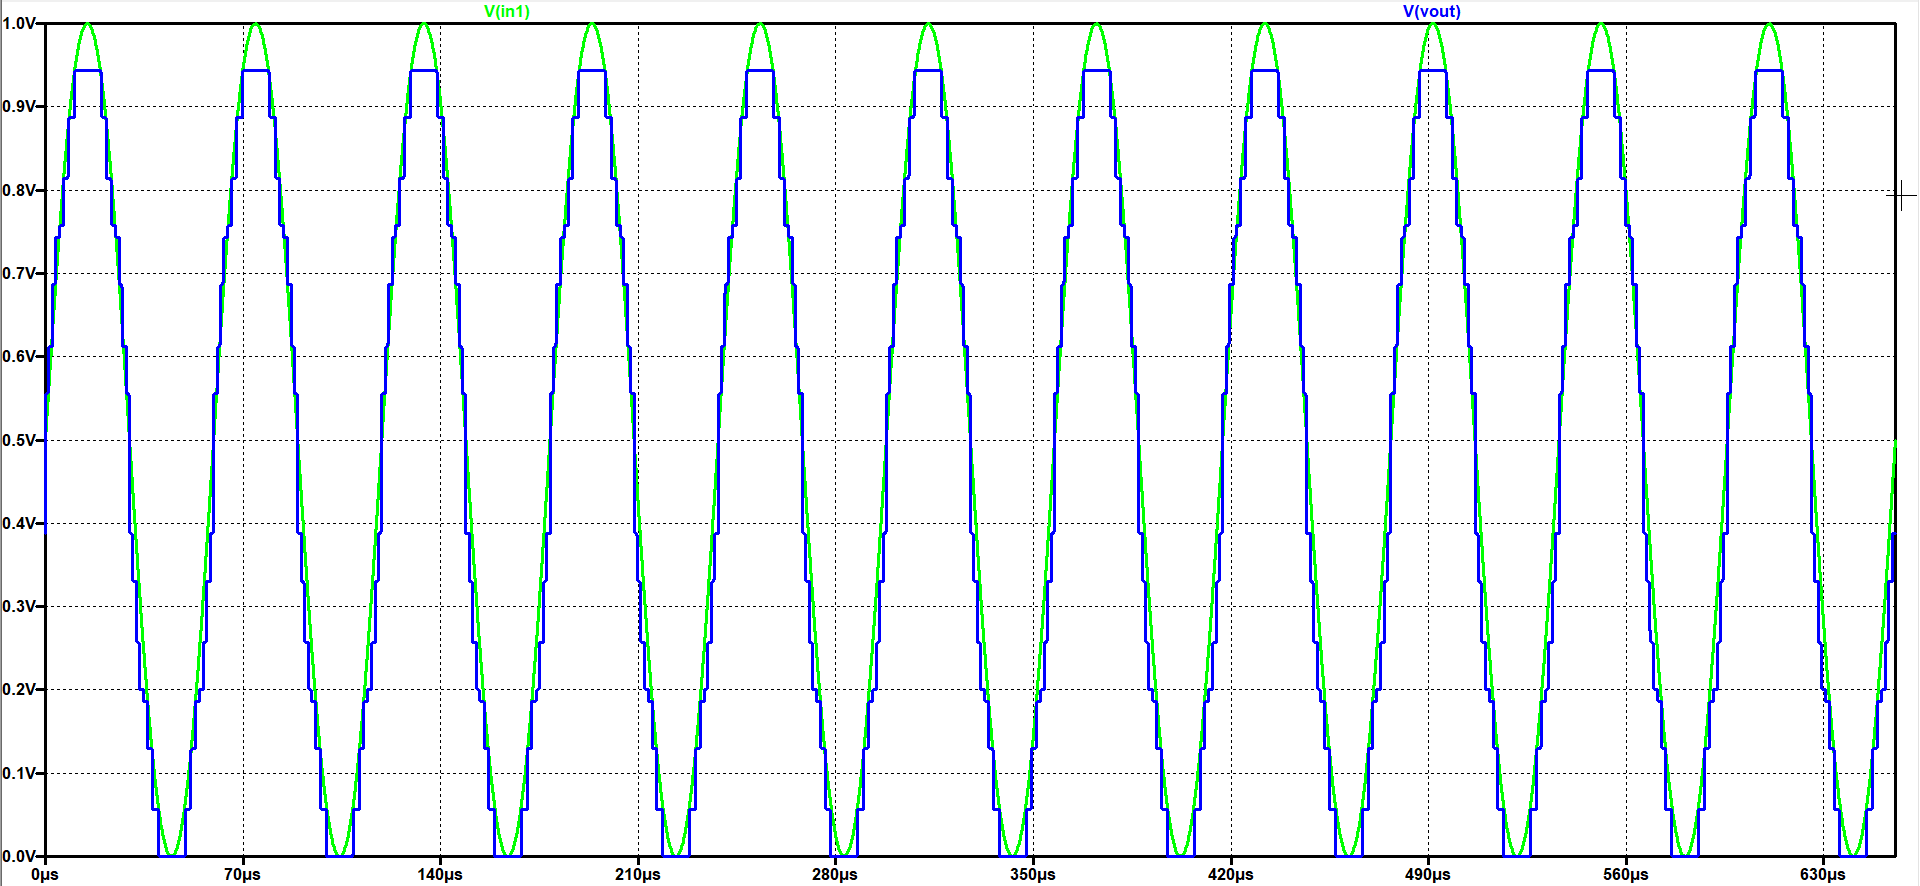
Simulation and analysis of a sinusoidal signal for the ADC R2R-DAC
After simulation of a ramp input signal, the R2R-DAC was simulated with a sinusoidal input signal.The output of the simulation can be seen in the following diagram.
A FFT-analysis in LTSpice was the next step and the following figure represent the results.
Afterwards the raw data was again uploaded to the 'Read-Raw-File-Tool'.
The integer values were extracted for the 'FFT-Tool' by mapping the extracted values and the histogram test can is presented in the next figure.
With the mapped integer values the 'FFT-Tool' was executed with the following results.